
The results of the 2019 Investment Executive (IE) Report Card series were largely positive, showcasing an expanding investment industry that remained strongest in the areas that advisors deemed most important.
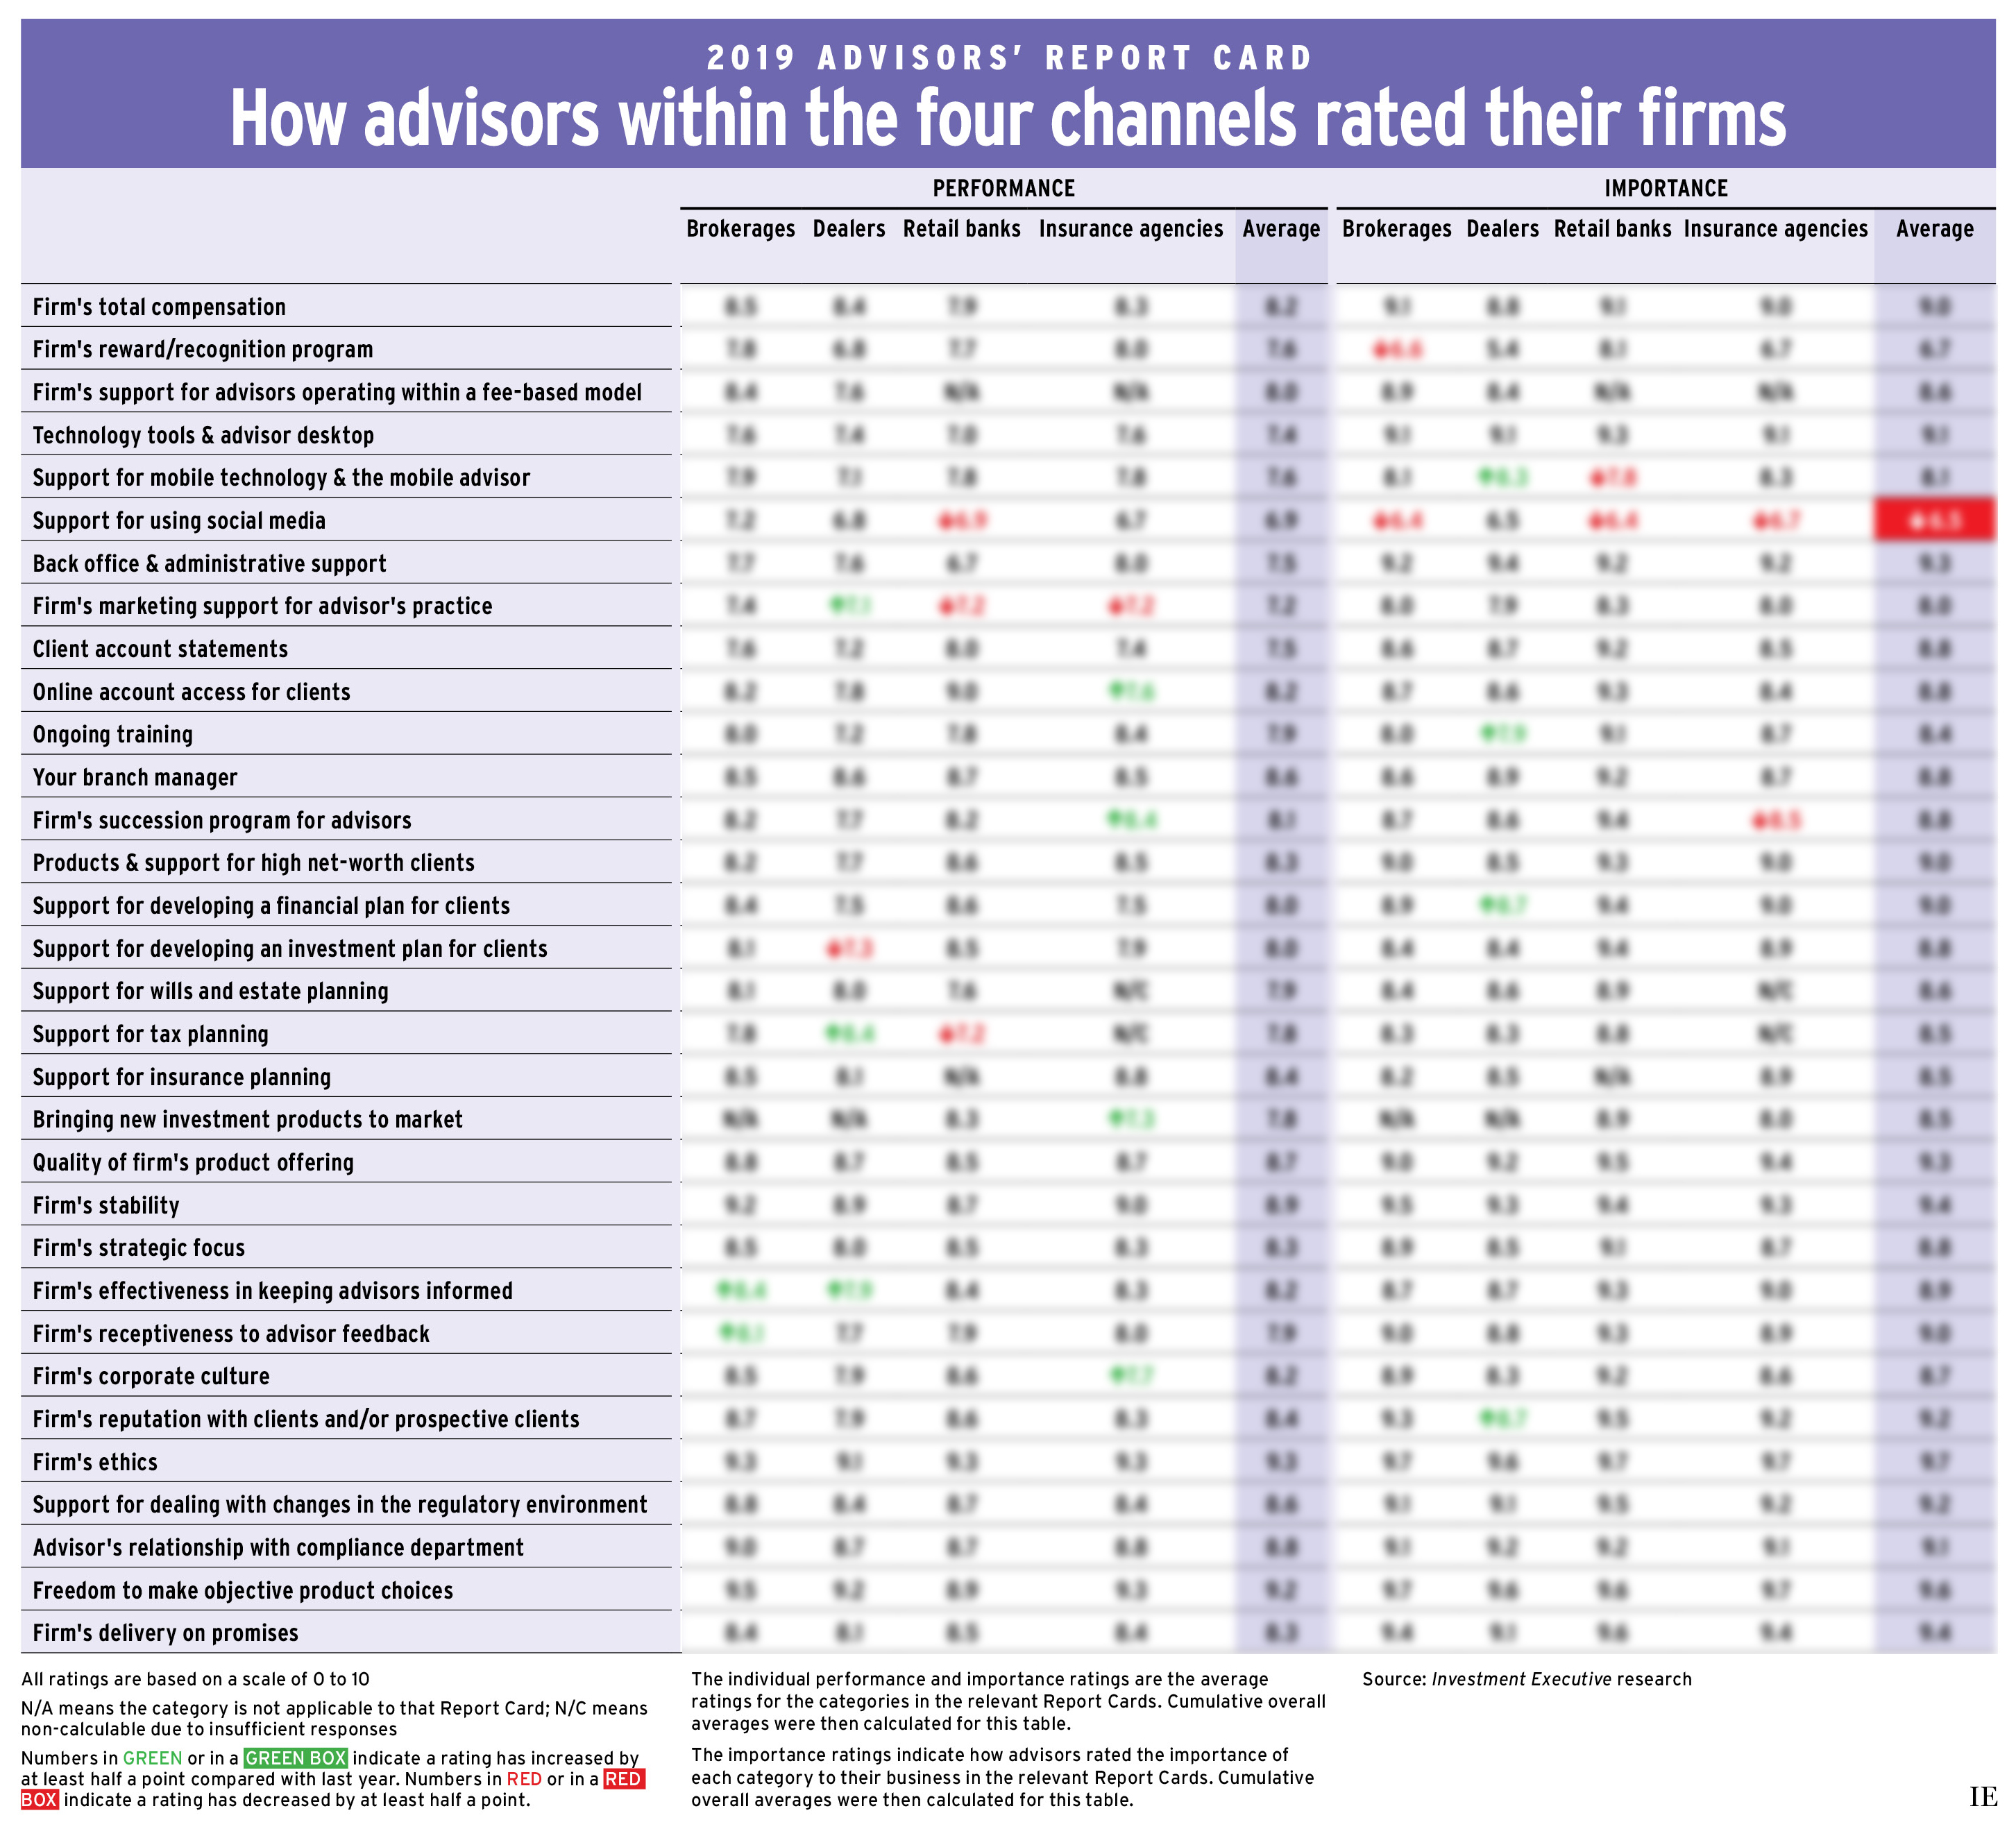
The advisors surveyed in the brokerage, dealer, bank and insurance segments continued to point to areas in which firms can improve, such as “technology tools & advisor desktop” and “ongoing training.” (See Firms can improve their training grades) Nonetheless, the collective average of the performance results for all 32 categories included in the Advisors’ Report Card was 8.1, which was slightly improved from last year’s 8.0.
In this year’s series, performance ratings for nine categories improved significantly (by 0.5 or more), compared with two a year ago. Only five fell by that same margin, compared with seven in 2018.
Click the image below to download a full-size version of the chart.
Those outcomes reflect the industry strength revealed across the 2019 Report Card series. From the brokerage space’s year-over-year bounceback, to the multi-year improvement of the dealer firms, to the relative calm seen in the bank and insurance Report Cards, each type of advisor seemed optimistic. (While not included in this analysis, the Regulators’ Report Card results were also robust; the collective “IE rating” – the average of all of a firm’s or organization’s category ratings – for the regulatory bodies included rose nearly 0.3 compared with a year ago.)
There was also a slight bump in the collective firm recommendation percentage: among all respondents, 90.9% would endorse their firm, compared with 90.2% a year ago.
Some advisors said “1,000% yes,” “absolutely” and “in a heartbeat” when asked if they’d recommend their firm, and many said they’ve actively recruited multiple people in recent years. When hesitation occurred, it was often due to leadership or pay changes.
In other cases, advisors acknowledged that their firms were suited for certain types of advisors. “I would recommend this firm to anybody who is looking at changing their business. I wouldn’t recommend the firm to a first-timer, though,” says one advisor in Alberta with Vancouver-based Canaccord Genuity Wealth Management (Canada). Stuart Raftus, the firm’s president, told IE earlier this year that the company focuses on attracting “highly experienced” advisors instead of rookies.
The four advisor surveys composing the Report Card series include categories that are mostly similar and comparable. However, there are survey differences due to the divergent structures and business models of each industry segment. As a result, individual segments weren’t assigned IE averages in this analysis.
With this in mind, there were common threads among the four segments represented.
Based on the advisors surveyed, significant business growth was evident in all four industry segments over the past 12 months. (See Surge in AUM and compensation) The average book size of all respondents was $109.5 million, a surge from $83.6 million a year ago. Advisors were also serving more client households: 278.8 on average vs 274.1 as found in 2018. (For the sake of comparability, 2018 book and client data excluded Toronto-based Bank of Nova Scotia advisors from the Report Card on Banks portion; they serve clients out of a collective base and couldn’t provide individual book information).
Also, many respondents praised the stability and ethics of their companies, and said they had ample freedom to choose products for clients.
The three best-performing categories in the Report Card series continued to be “firm’s ethics” (9.3, up from 9.1 in 2018), “freedom to make objective product choices” (9.2, also up from 9.1) and “firm’s stability” (8.9, unchanged from a year ago). The two most-improved categories, both up 0.4 from a year ago, were related to those areas: “bringing new investment products to market” (7.8) – only applicable to bank and insurance advisors – and “firm’s corporate culture” (8.2), which applied to all respondents aside from those working with managing general agencies in the insurance space.
The categories deemed most important were also the ethics (9.7, up from 9.6) and product freedom (9.6, unchanged from a year ago) categories. They were followed by “firm’s delivery on promises” and the stability category (both rated 9.4, compared with 9.3 and 9.4 in 2018, respectively).
“Independence in this industry is becoming extremely rare. And we need independent advice. Otherwise, the public is shortchanged,” says an advisor in Quebec with Toronto-based Richardson GMP Ltd. When it comes to promises made by firms, an Ontario advisor with London, Ont.-based Freedom 55 Financial says, “If somebody gives you their word, you want to see [that] they keep it.”
The three categories with the weakest performance averages were once again “support for using social media” (6.9), “firm’s marketing support for advisor’s practice” (7.2) and the technology tools category (7.4); the first two were down 0.1 compared with a year ago, while the third’s rating was unchanged.
The categories with the largest satisfaction gaps (the amount by which a category’s importance exceeds its performance) in this year’s series were also similar to the past few years. At the top of the list were “back office & administrative support” (gap of 1.8, unchanged from 2018) and the technology tools category (gap of 1.7, also unchanged). They were followed by “client account statements,” with a gap of 1.3 that was up 0.1 vs 2018.
“[Firms] need to have people in clear roles and people [who] know what they are doing,” says an advisor in Atlantic Canada with Mississauga, Ont.-based Investment Planning Counsel Inc. about the back office.
IE ratings trends across the Report Card series reflect an overall optimism.
As mentioned, firms from different segments – and the segments themselves – shouldn’t be compared directly due to survey differences. Nonetheless, it’s illuminating that seven firms had IE ratings of 9.0 and above (the highest rating for 2019 was 9.2), while six had ratings of 7.5 and below (the lowest rating of 2019 was 7.2). That compares with only four firms with IE ratings of 9.0 or higher in 2018 vs eight with ratings of 7.5 or lower a year ago.
Within the 9.0 and above group (which consists of firms from three of the four Report Cards), the majority had their top ratings in the ethics, product freedom and stability categories – the same ones that led the 2019 series for performance and, crucially, for importance to advisors. Many of these firms were also rated well for their delivery on promises and compliance support.
Meanwhile, within the 7.5 and lower group (which included firms from the entire Report Card series), all but one firm had their lowest rating in either the social media or marketing support categories. Further, all had below-average ratings for their technology tools, though some were rated well in the product freedom category.
As a result, it seems that common areas helped drive firm performance. Indeed, when asked about the positive and negative aspects of their firms, advisors frequently brought up “independence” and “technology.”
About firms allowing independence and helping staff put clients first, one advisor in Alberta with Mississauga, Ont.-based Edward Jones says, “You can’t put a dollar value on that.”
In reference to the power of technology, an advisor in Ontario with Scotiabank says, “When it comes to our clients, [technology] needs to work efficiently. That will take a bit of pressure off, so we can focus on more important things.”
How we did it
This year, Investment Executive conducted five surveys, four of which focused on segments of the financial advice industry. These four were the 2019 Brokerage Report Card, Dealers’ Report Card, Report Card on Banks and Insurance Advisors’ Report Card, for which a total of 1,771 respondents from 38 firms were interviewed. Across the four Report Cards, respondents had to have worked for the firms they were rating for at least one year and in the industry for three, among other segment-specific requirements.
Between Jan. 2 and June 14, 2019, a team of six research journalists conducted the interviews: Jordan Barrera, Daniel Calabretta, Maddie Johnson, Bryson Masse, Surina Nath and Marina Tyszkiewicz. They asked the advisors to provide two ratings for a collection of categories that applied to their practices and to the firms, banks or insurance agencies that they worked for or with. For both the performance and importance of the categories, the advisors had to provide a rating of between zero (meaning “poor” or “unimportant”) and 10 (meaning “excellent” or “critically important”). Advisors were also asked to provide an overall rating for their firms on the same scale, and whether they’d recommend their firms if asked by another advisor.
The Advisors’ Report Card examines the categories relevant to all industry segments and for which questions were posed to all respondents.
Respondents were also asked two supplementary, multiple-choice questions. One was about what advisors see as a threat to revenue for their businesses for the following 12 months, and the other was about what regulators should focus on as they reduce industry red tape.