“When CX initiatives don’t deliver, CEOs cease to support them, plain and simple. Since CX practitioners fully recognize that ‘connecting CX with business results’ is the key to gaining buy-in from CEOs, why has this disconnect prevailed?”
— Sampson Lee, author at Customer Think
Customer experience measurement is a complex topic. Most experiences have multiple touchpoints, possibly in different channels, with different objectives. How do you know what’s working and what’s not?
Using a customer journey map to visualize your experience is a great place to start. Journey maps are a visual story about how people interact with your brand. They help companies gain a deep understanding of their customers and act as a bridge between businesses and buyers.
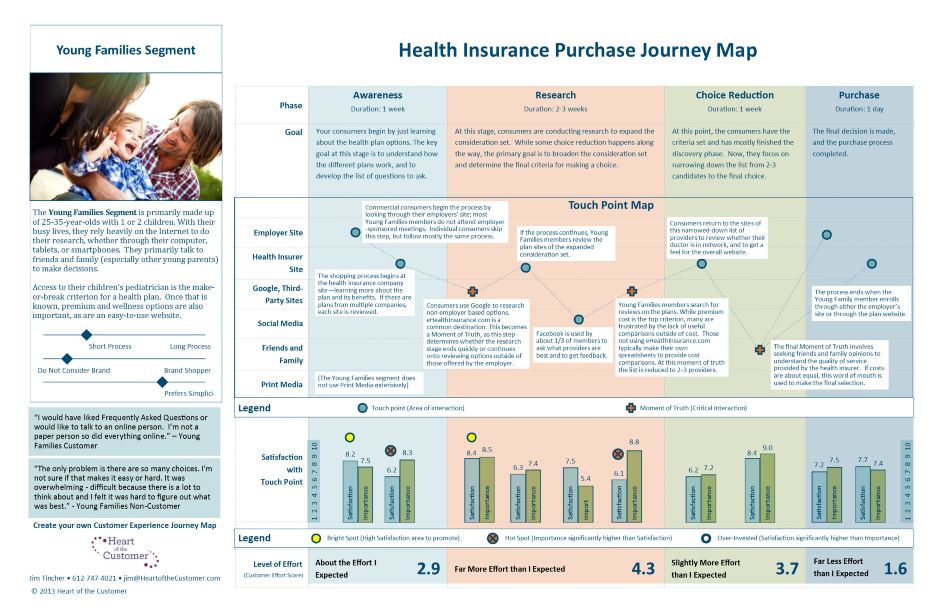
An example customer journey map from MyCustomer
According to consultancy Nielson Norman Group, one of the key indicators that a journey map will succeed is when it produces measurable results. But that same research found that 80% of experience designers don’t use metrics in their journey maps.
Why the disconnect? Often it’s because including metrics with your customer journey map adds complexity to an already challenging project. In this article, I propose a three-step model through which to frame your approach to gathering metrics for your customer journey.

Photo by You X Ventures on Unsplash
A three-step approach to measuring your customer journey
A common barrier to matching metrics with the customer journey map is being overwhelmed by choice. Should we measure the entire journey or individual journeys? Are these the right metrics to measure? How do we match the right metrics to the right journeys?
To approach this challenge, I recommend a three-step framework that allows you to measure the components of a customer journey and the sum of its parts:
The measurement framework:
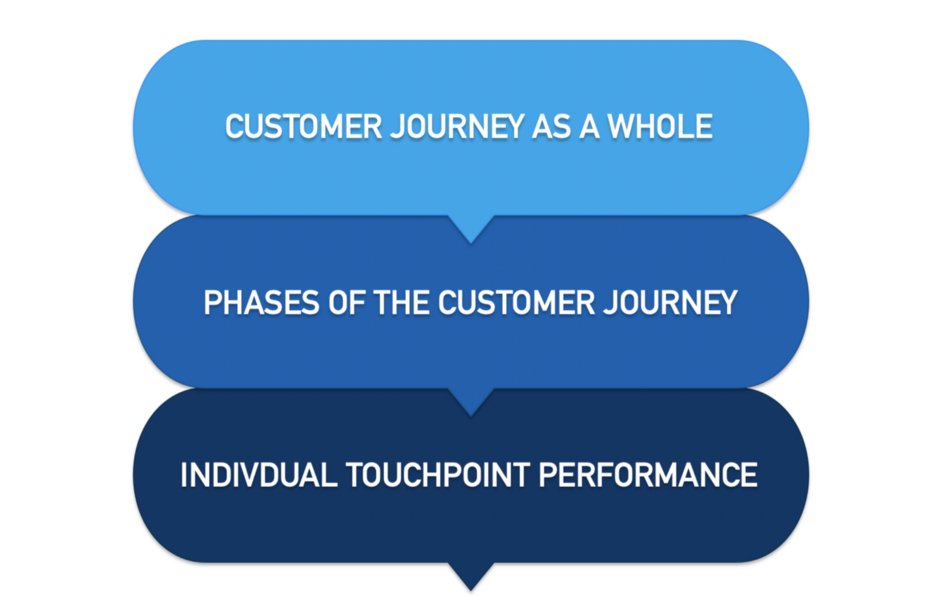
Source: Image created by the author
Step 1: Measure the overall customer journey
Our first task is defining a metric to define success for the customer journey as a whole. This metric will be our ultimate measure of customer experience success.
Our guiding question is this step is, “When taken as a whole, how effective is our customer journey?”
When measuring our experience, it’s better to be journey-led rather than touchpoint-led. After surveying 27,000 consumers, McKinsey found that measuring the overall journey was a better predictor of an effective experience than measuring touchpoints. As they stated:
A company’s performance on journeys is 35 percent more predictive of customer satisfaction and 32 percent more predictive of customer churn than performance on individual touchpoints.
Examples of commonly used metrics for the overall experience include the Net Promoter Score, Customer Effort Score, and Customer Satisfaction.
1. Net Promoter Score (NPS)
Many companies use the Net Promoter Score, or NPS, as a way to measure their overall experience. This metric tracks how likely a customer is to recommend a brand to their family and friends.

Source: Net Promoter Score
NPS measures customer loyalty and advocacy. It can give you an understanding of how the overall experience works and takes into account every piece of the journey: products, price, onboarding, retail experience, marketing, touchpoints, brand, and customer service.
2. Customer Effort Score (CES)
The Customer Effort Score, or CES, measures how much effort customers have to exert to reach their goals. Whether that’s ordering a product, getting a question answered, an issue resolved, or returning a product.
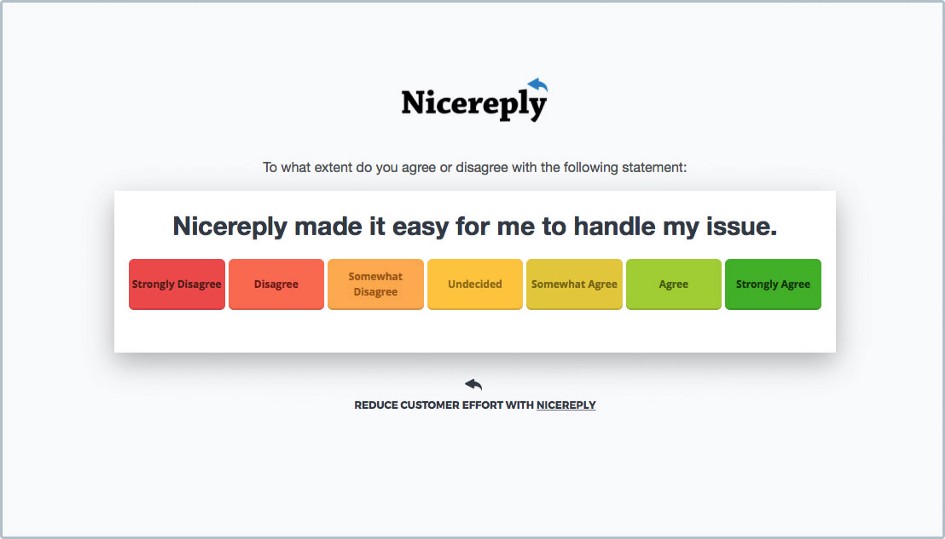
Source: Kayako
Customer effort has a clear relationship with customer loyalty — the higher the effort, the lower the loyalty. According to research from Gartner, 94% of customers who had low-effort experiences expressed intent to repurchase. Compare that with customers who had a high-effort experience — only 4% expressed intent to buy again.
94% of customers who have a low-effort experience express intent to repurchase.
The Customer Satisfaction score, or CSAT, measures how delighted your customers are with their experience. You can use this metric for single interactions or the overall experience.

Source: Qualtrics
CSAT works better as an “in-the-moment” measure because it has a weaker relationship to long-term customer loyalty than NPS or CES. The benefit of CSAT is its flexibility. It can be broken into individual questions to focus on specific parts of the customer journey.
Which of these metrics is best at measuring the overall customer experience?
There is some debate around which of these high-level metrics (or what combination) produces the best results for brands.
According to the research firm Gartner, CES outperforms NPS, and CSAT in predicting customer repurchase and increased spending, as seen in the chart below. Keep in mind that Gartner now owns the firm that creates the Customer Effort Score, so their findings may be biased.
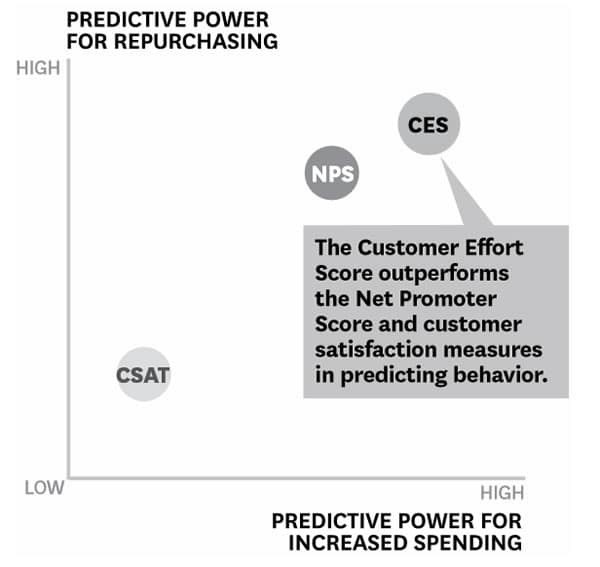
Source: iScoop
On the other hand, consulting firm McKinsey had this to say about the importance of customer satisfaction (CSAT):
Maximizing satisfaction with customer journeys has the potential not only to increase customer satisfaction by 20 percent but also to lift revenue by up to 15 percent.
Each of these metrics has positive and negative attributes. In practice, you’ll probably need to track more than one of these metrics to get a holistic picture of how well your journey is working.
Step 2: Align metrics to the purchase journey
The purchase journey usually includes 4–5 steps, and the metrics you use to measure each will differ. Your journey map might have more or slightly different stages, but this general framework applies to most B2C customer journeys.
The critical question to answer in this step is, “Does each phase of our journey perform its primary goal?”

Source: Created by author
Here are some key questions and measures for each of these phases:
1. Awareness
- Key Question: Are customers aware of our brand, products, and product features?
- Example Metrics: Share of Voice (SOV) in the market, number of visits and users to your website
2. Consideration
- Key Question: When customers know they want to buy the type of product we sell, are they seeking us out?
- Example Metrics: Organic keyword traffic (specifically around our brand or product), direct traffic to the website, retail store footfall
3. Purchase
- Key Question: Once customers begin the buying process, are they completing their purchases?
- Example Metrics: Abandoned basket rates, footfall in retail stores vs. purchases
4. Retention
- Key Question: After customer shops with us, are they returning to shop with us again?
- Example Metrics: Customer Lifetime Value (CLV), customer service ticket volume, return visitors, frequency of session, session length
5. Advocacy
- Key Question: After our customers have shopped with us, how likely are they to recommend
- Example Metrics: Net promoter score (NPS) at specific points of a journey, sentiment via social listening, use of affiliate and referral codes
Step 3: Define specific touchpoint metrics
Make sure to pull control groups that both use and don’t use this touchpoint, to make sure there aren’t confounding factors at play when you measure success.
The critical question in this step is, “Do our touchpoints reduce friction and delight customers?”

Photo by Blake Wisz on Unsplash
Examples of physical touchpoint metrics
- Retail store: Footfall vs. number of purchases, basket size, overall sales in retail, number of queries to staff, the salience of sign-posting
- Retail point of purchase communications (POP): Sales uplift of featured products, visual salience, overall sales uplift, halo effect on category sales
Examples of digital touchpoint metrics
- eCommerce website: Uptime, drop-off points, bounce rate, loading speed, mobile page performance, dwell time
- Online chat support: Length of support interactions, customer satisfaction surveys post-chat, repeat purchase from customer, wait-time, customer sentiment in chat
Specific touchpoint metrics do matter — we need to know where we’re failing to delight customers. But not all touchpoints have equal weight on overall customer satisfaction. Some touchpoints, like posters, may only need one metric to determine if they’re working. Other more critical touchpoints, like websites, may require more than one metric.
How do we know which touchpoints are more important to overall customer satisfaction? The answer lies in a behavioral science principle known as the Peak-end Rule.
The Peak-end Rule: A behavioral science principle that can transform your customer experience
The Peak-end Rule states that people judge an experience based on how they felt at its peak and its end, not the average of every moment of the experience. And that’s true whether the experience was good or bad.
For brands, this means customers will remember their whole experience based on only two moments — the best (or worst) part of their experience, and the end.
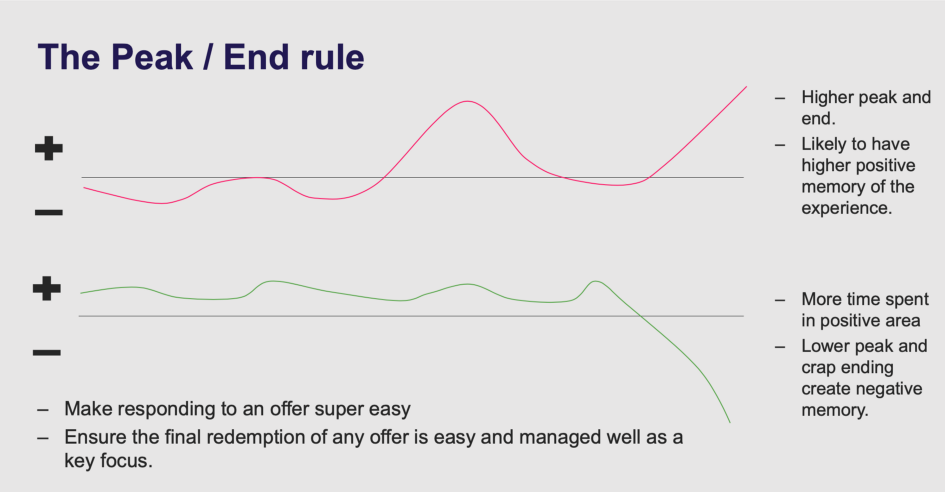
Source: Rob Voase
That’s great news because, according to science, you don’t have to give equal time, money, and attention to optimizing every touchpoint. To transform customer satisfaction, you only have to perfect two moments — the peak and end.
Remember — to give your metrics meaning, give them context
It’s important to remember that metrics can be deceiving. It’s easy to misinterpret a number when there’s no context or customer feedback. For example, dwell time on a website is commonly misunderstood.
You might initially believe that dwell time is good. After all, customers are enjoying their experience so much they want to prolong it. But they might be dwelling because they don’t understand what to do next, which would result in a bad overall experience.
Be sure to layer qualitative research, including observational studies, onto quantitative data to understand the “why” behind the “what.”


