Money
Visualized: The Most (and Least) Expensive Cities to Live In


Visualizing The Most (and Least) Expensive Cities to Live In
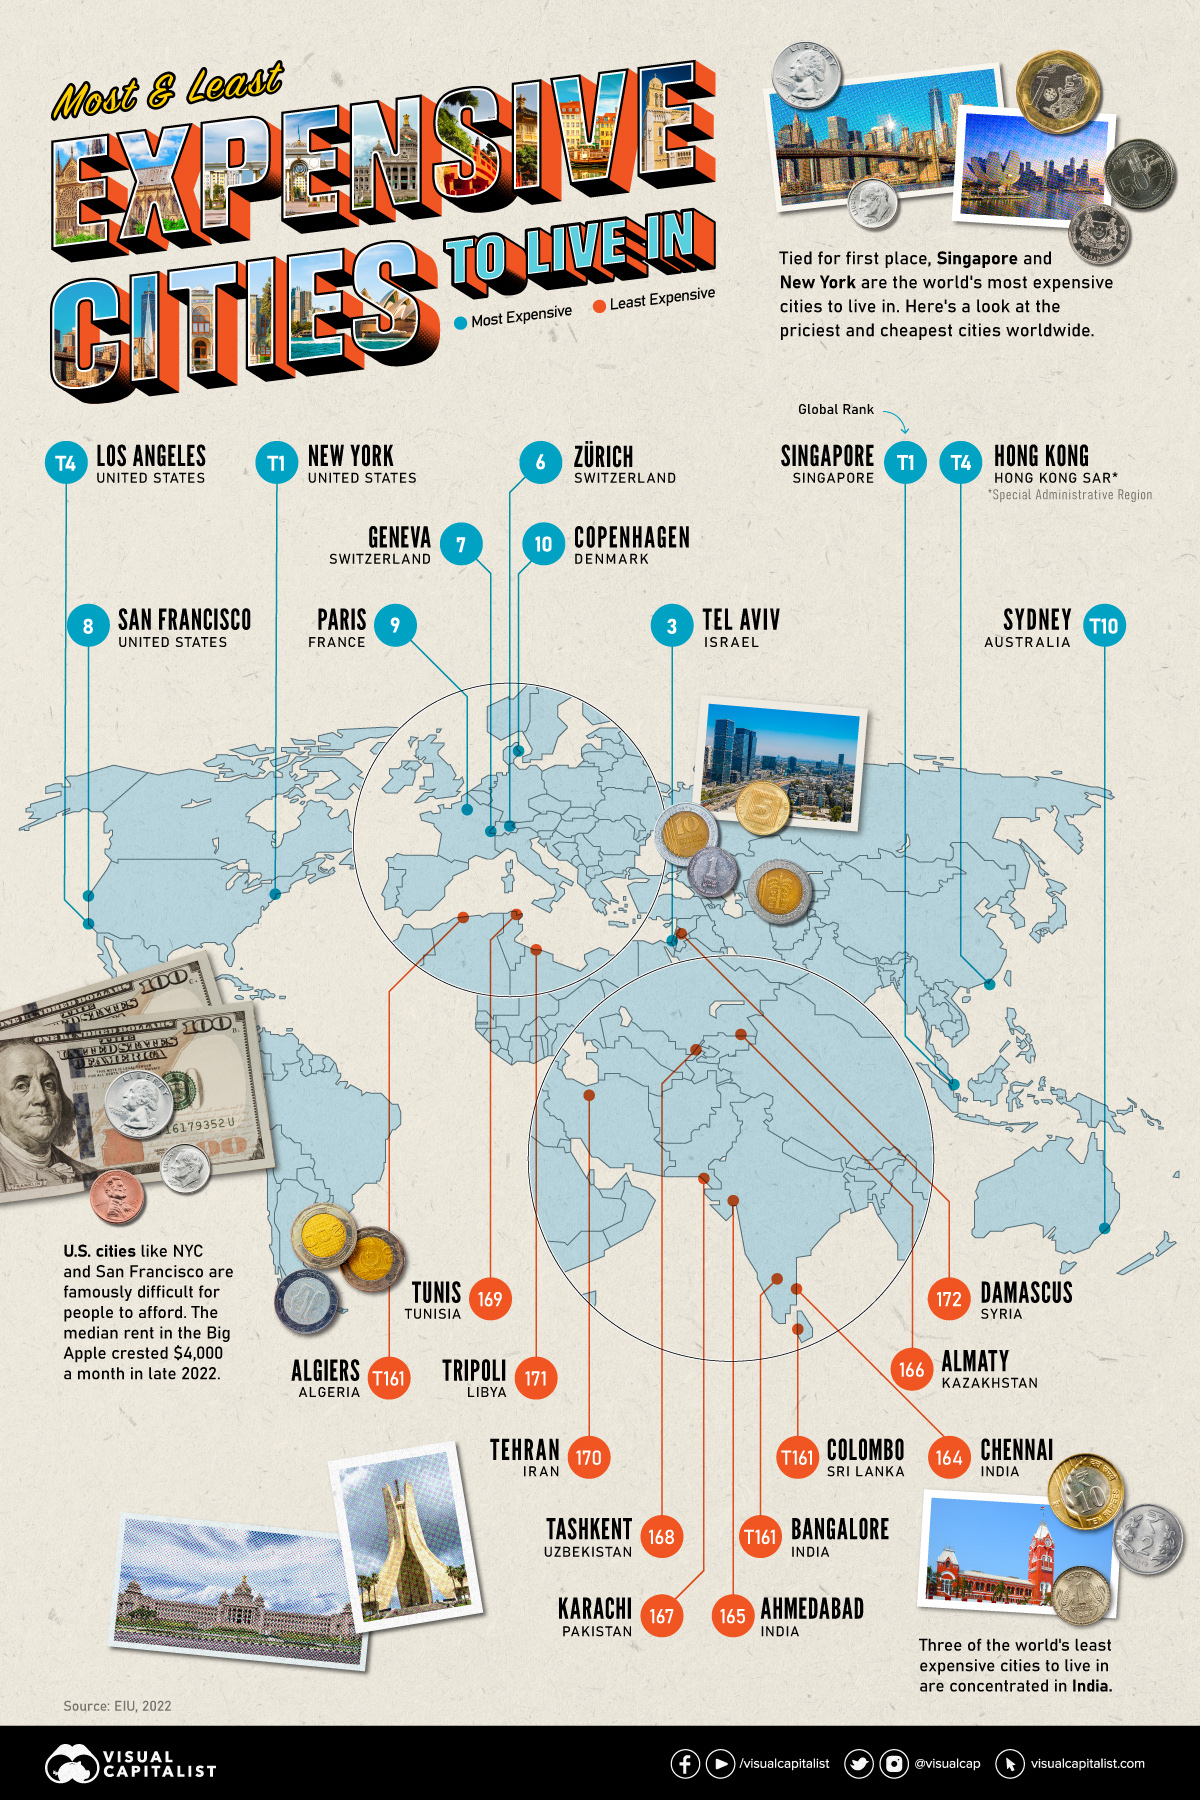
There are many benefits to living in an iconic city like New York or Singapore, but the amenities and exclusivity can come at a high cost.
Cities become “expensive” due to a variety of factors such as high demand for housing, a concentration of high-paying businesses and industries, and a high standard of living. Additionally, factors such as taxes, transportation costs, and availability of goods and services can also contribute to the overall cost of living in global cities.
The infographic above uses data from EIU to rank the world most and least expensive cities to live in. To make the list, the EIU examines 400+ prices for over 200 products and services in 172 cities, surveying a variety of businesses to track price fluctuations over the last year.
Inflation + Strong Currency = Expensive Cities
If you live in a city where many residents find it challenging to put a roof over their heads, food on their plates, and make ends meet, you live in an expensive city.
But if this inflation is compounded with a strong national currency, you may live in one of the world’s most expensive cities.
| Rank | City | Country | Index Score |
|---|---|---|---|
| #1 | Singapore | 🇸🇬 Singapore | 100 |
| #1 | New York | 🇺🇸 U.S. | 100 |
| #3 | Tel Aviv | 🇮🇱 Israel | 99 |
| #4 | Hong Kong | 🇭🇰 Hong Kong | 98 |
| #4 | Los Angeles | 🇺🇸 U.S. | 98 |
| #6 | Zurich | 🇨🇭 Switzerland | 94 |
| #7 | Geneva | 🇨🇭 Switzerland | 91 |
| #8 | San Francisco | 🇺🇸 U.S. | 85 |
| #9 | Paris | 🇫🇷 France | 84 |
| #10 | Copenhagen | 🇩🇰 Denmark | 83 |
Singapore and New York City tied for the first rank amongst the world’s most expensive cities in 2022, pushing Israel’s Tel Aviv from the first place in 2021 to the third place in 2022. Both these cities had high inflation and a strong currency. Surprisingly, this is the Big Apple’s first time atop the ranking.
The city with one of the most expensive real estate markets worldwide, Hong Kong ranked fourth in this list, followed by Los Angeles, which moved up from its ninth rank in 2021.
Poor Economies = Cheaper Cities
Asia continues to dominate the list of the world’s least expensive cities, followed by parts of North Africa and the Middle East. Though affordability sounds good at face value, sitting at the bottom of the ranking isn’t necessarily a coveted position.
While the cost of living in some of the cities in these nations is low, it comes at the price of a weak currency, poor economy, and, in many cases, political and economic turmoil.
| Rank | City | Country | Index Score |
|---|---|---|---|
| #161 | Colombo | 🇱🇰 Sri Lanka | 38 |
| #161 | Bangalore | 🇮🇳 India | 38 |
| #161 | Algiers | 🇩🇿 Algeria | 38 |
| #164 | Chennai | 🇮🇳 India | 37 |
| #165 | Ahmedabad | 🇮🇳 India | 35 |
| #166 | Almaty | 🇰🇿 Kazakhstan | 34 |
| #167 | Karachi | 🇵🇰 Pakistan | 32 |
| #168 | Tashkent | 🇺🇿 Uzbekistan | 31 |
| #169 | Tunis | 🇹🇳 Tunisia | 30 |
| #170 | Tehran | 🇮🇷 Iran | 23 |
| #171 | Tripoli | 🇱🇾 Libya | 22 |
| #172 | Dasmascus | 🇸🇾 Syria | 11 |
The decade-long conflict in Syria weakened the Syrian pound, led to a spiraling inflation and fuel shortages, and further collapsed its economy. It’s no surprise that its capital city of Damascus has maintained its position as the world’s cheapest city.
Tripoli and Tehran, the capitals of Libya and Iran, respectively, follow next on this list, reflecting their weakened economies.
Meanwhile, seven cities in Asia with the common denominator of high-income inequality and low wages dominate the list of the world’s cheapest cities. These include three Indian cities, Tashkent in Uzbekistan, Almaty in Kazakhstan, Pakistan’s most populous city of Karachi, and Sri Lankan capital–Colombo.


Economy
Ranked: The Top 20 Countries in Debt to China
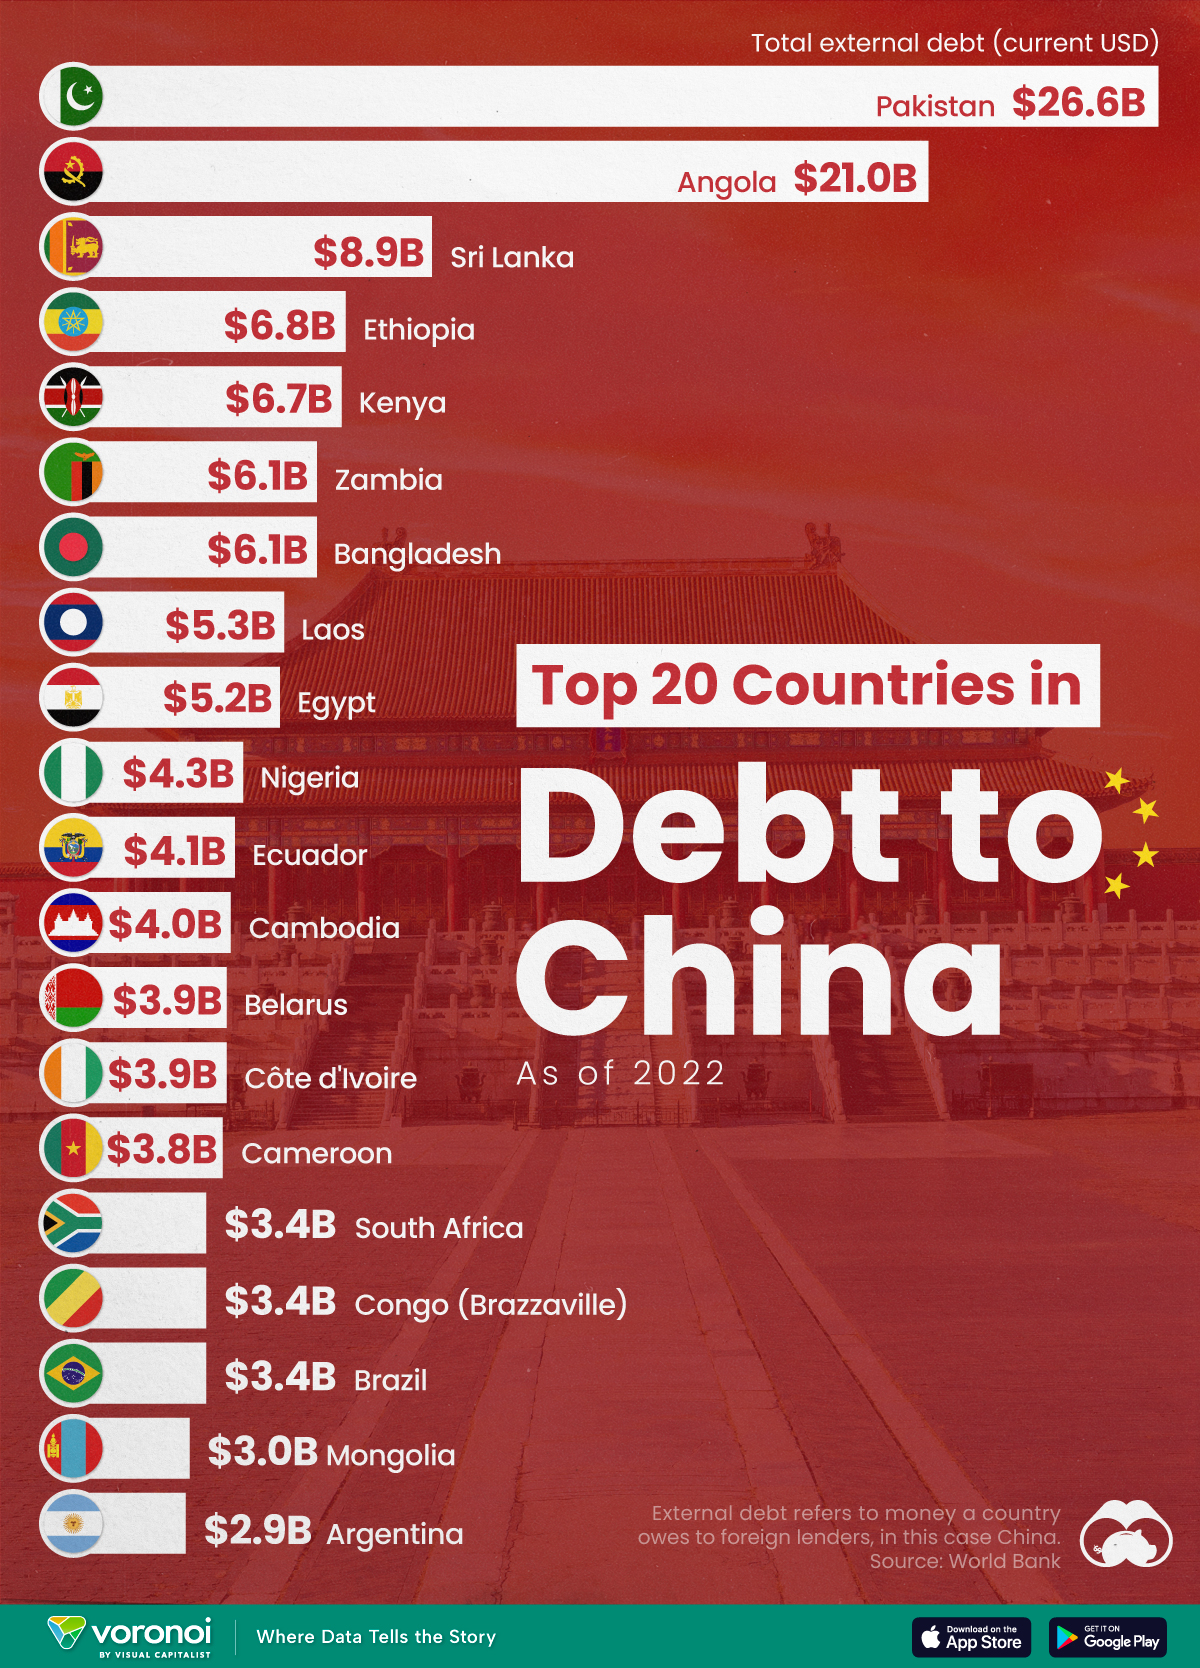
The 20 nations featured in this graphic each owe billions in debt to China, posing concerns for their economic future.
Ranked: The Top 20 Countries in Debt to China
This was originally posted on our Voronoi app. Download the app for free on iOS or Android and discover incredible data-driven charts from a variety of trusted sources.
In this graphic, we ranked the top 20 countries by their amount of debt to China. These figures are as of 2022, and come from the World Bank (accessed via Yahoo Finance).
The data used to make this graphic can be found in the table below.
| Country | Total external debt to China ($B) |
|---|---|
| 🇵🇰 Pakistan | $26.6 |
| 🇦🇴 Angola | $21.0 |
| 🇱🇰 Sri Lanka | $8.9 |
| 🇪🇹 Ethiopia | $6.8 |
| 🇰🇪 Kenya | $6.7 |
| 🇧🇩 Bangladesh | $6.1 |
| 🇿🇲 Zambia | $6.1 |
| 🇱🇦 Laos | $5.3 |
| 🇪🇬 Egypt | $5.2 |
| 🇳🇬 Nigeria | $4.3 |
| 🇪🇨 Ecuador | $4.1 |
| 🇰🇭 Cambodia | $4.0 |
| 🇨🇮 Côte d'Ivoire | $3.9 |
| 🇧🇾 Belarus | $3.9 |
| 🇨🇲 Cameroon | $3.8 |
| 🇧🇷 Brazil | $3.4 |
| 🇨🇬 Republic of the Congo | $3.4 |
| 🇿🇦 South Africa | $3.4 |
| 🇲🇳 Mongolia | $3.0 |
| 🇦🇷 Argentina | $2.9 |
This dataset highlights Pakistan and Angola as having the largest debts to China by a wide margin. Both countries have taken billions in loans from China for various infrastructure and energy projects.
Critically, both countries have also struggled to manage their debt burdens. In February 2024, China extended the maturity of a $2 billion loan to Pakistan.
Soon after in March 2024, Angola negotiated a lower monthly debt payment with its biggest Chinese creditor, China Development Bank (CDB).
Could China be in Trouble?
China has provided developing countries with over $1 trillion in committed funding through its Belt and Road Initiative (BRI), a massive economic development project aimed at enhancing trade between China and countries across Asia, Africa, and Europe.
Many believe that this lending spree could be an issue in the near future.
According to a 2023 report by AidData, 80% of these loans involve countries in financial distress, raising concerns about whether participating nations will ever be able to repay their debts.
While China claims the BRI is a driver of global development, critics in the West have long warned that the BRI employs debt-trap diplomacy, a tactic where one country uses loans to gain influence over another.
Editor’s note: The debt shown in this visualization focuses only on direct external debt, and does not include publicly-traded, liquid, debt securities like bonds. Furthermore, it’s worth noting the World Bank data excludes some countries with data accuracy or reporting issues, such as Venezuela.
Learn More About Debt from Visual Capitalist
If you enjoyed this post, check out our breakdown of $97 trillion in global government debt.

-

 Economy7 days ago
Ranked: The Top 20 Countries in Debt to China
-

 Demographics2 weeks ago
The Countries That Have Become Sadder Since 2010
-

 Money2 weeks ago
Charted: Who Has Savings in This Economy?
-

 Technology2 weeks ago
Visualizing AI Patents by Country
-

 Economy2 weeks ago
Economic Growth Forecasts for G7 and BRICS Countries in 2024
-

 Wealth2 weeks ago
Charted: Which City Has the Most Billionaires in 2024?
-

 Technology1 week ago
All of the Grants Given by the U.S. CHIPS Act
-

 Green1 week ago
The Carbon Footprint of Major Travel Methods