
Plant Defense Elicitation by the Hydrophobin Cerato-Ulmin and Correlation with Its Structural Features
 , , , , and
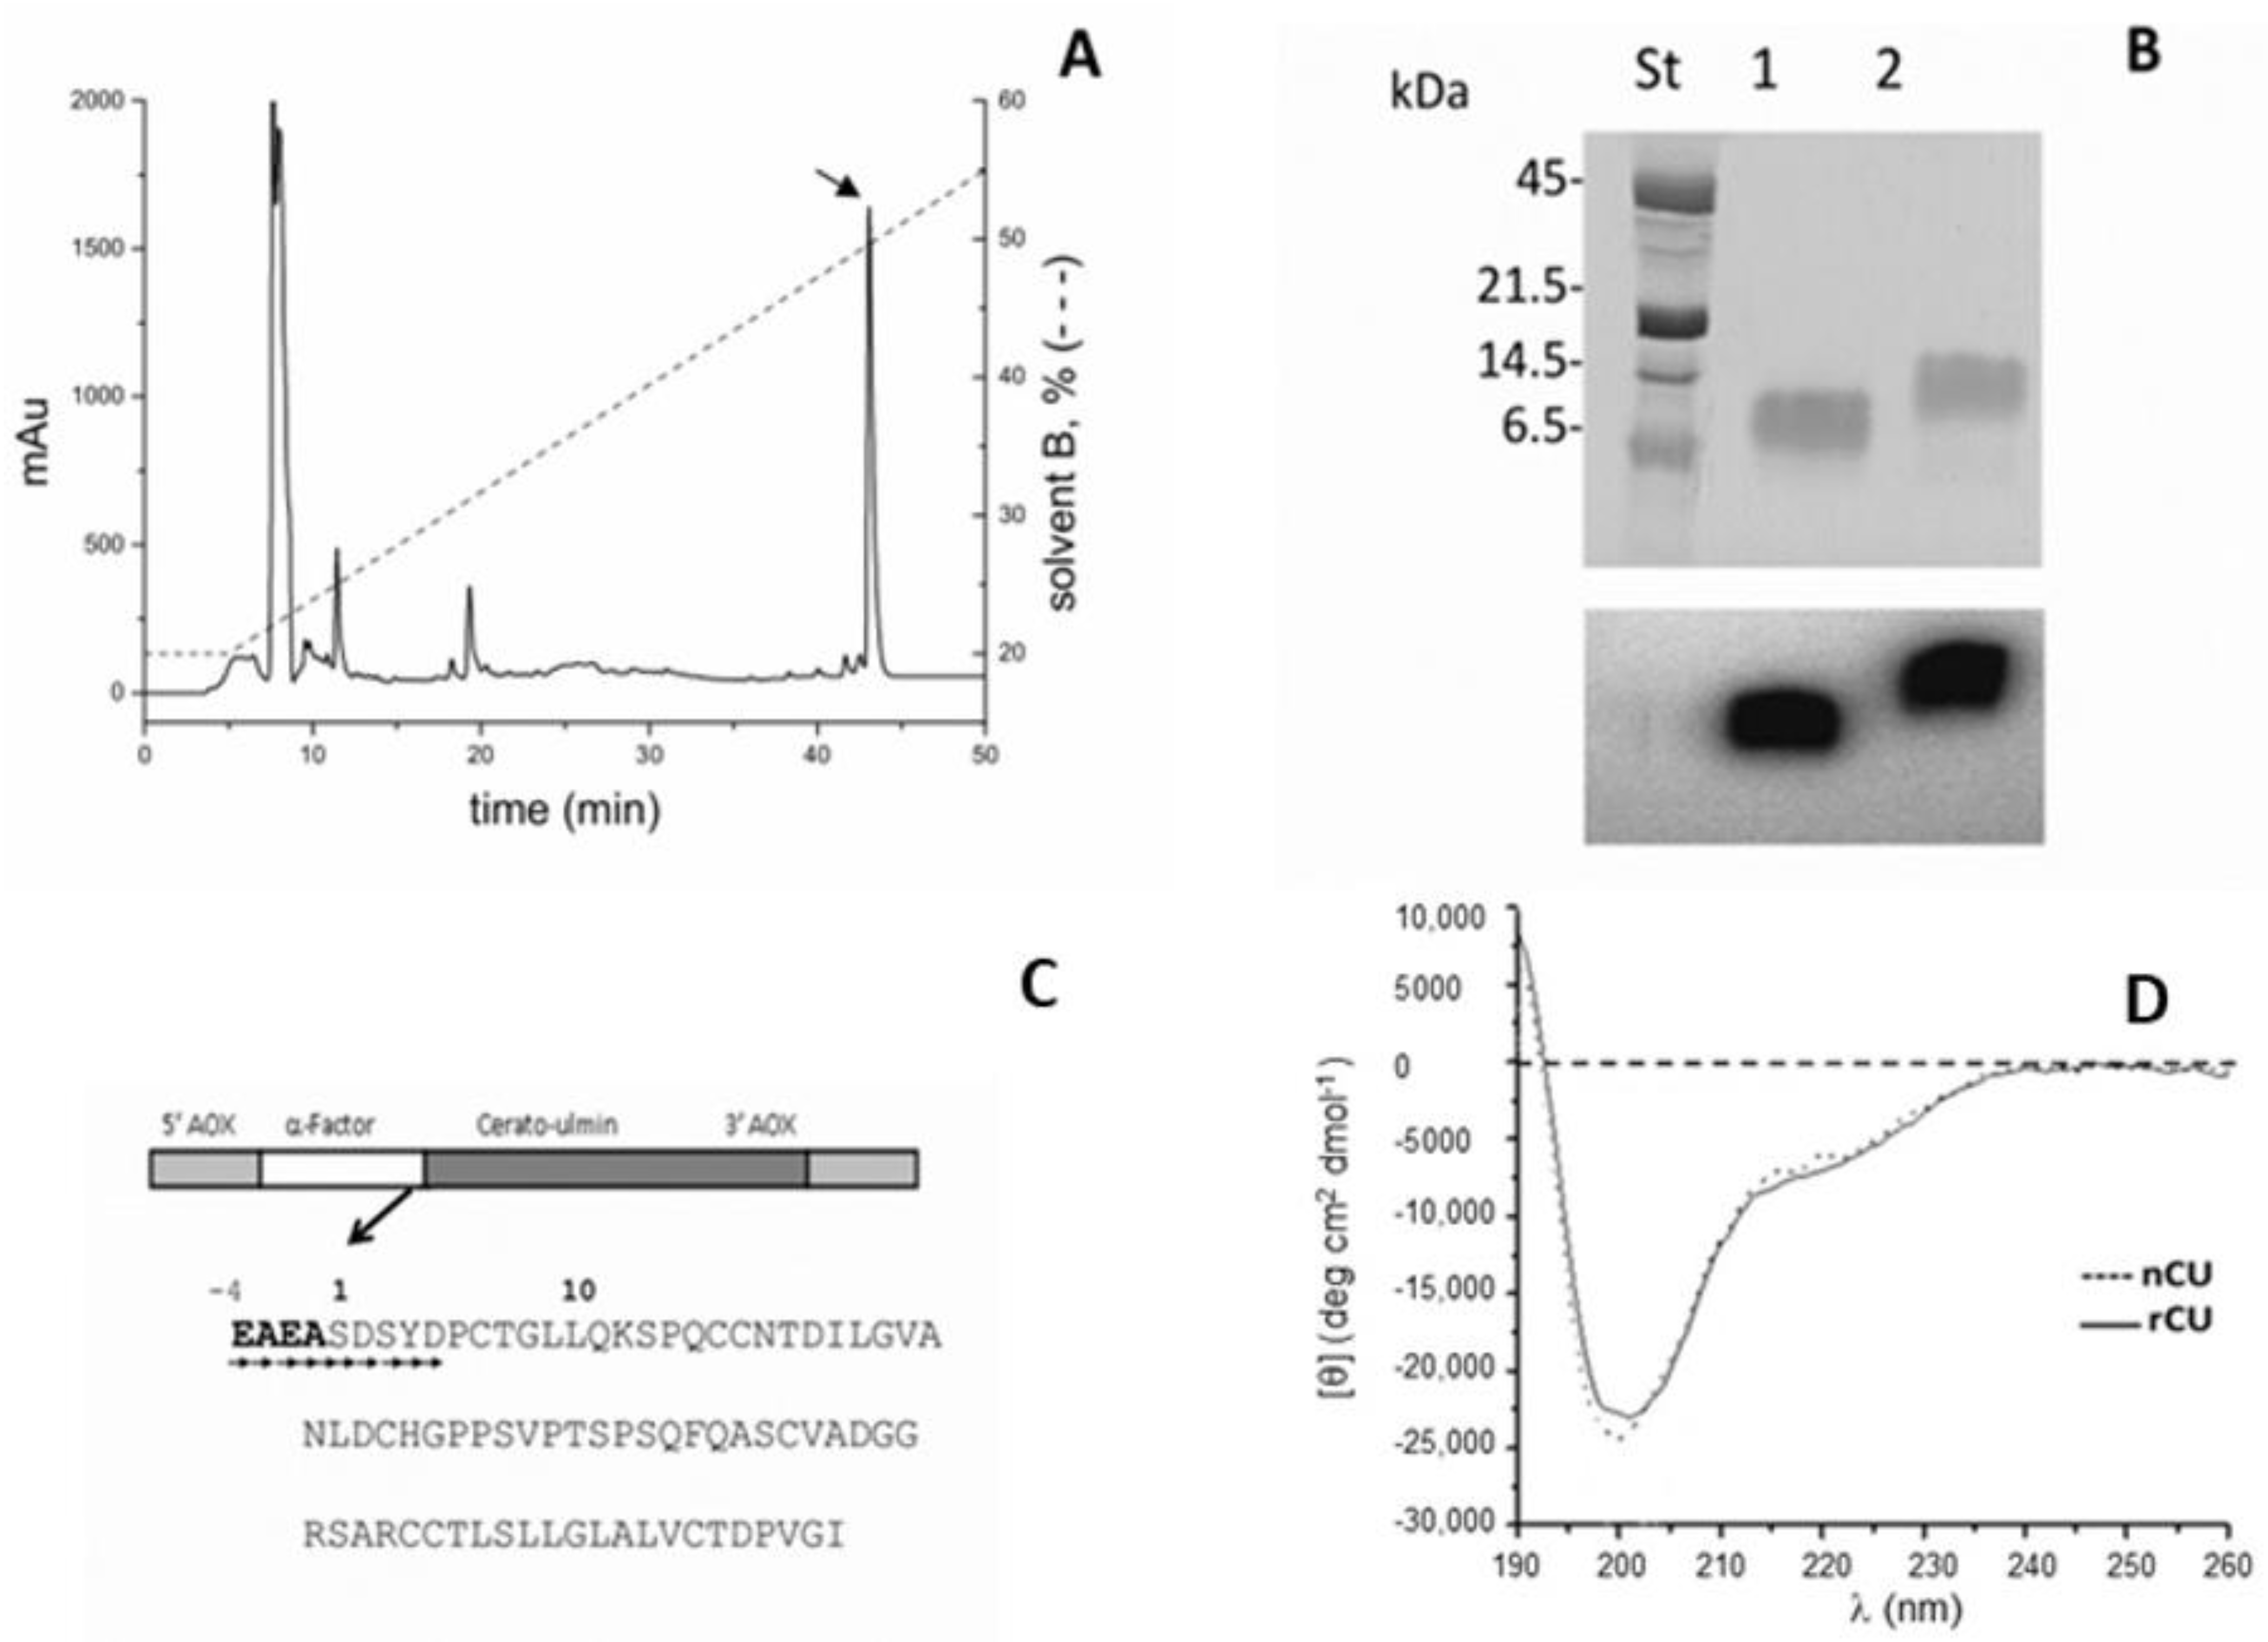
Abstract
:1. Introduction
2. Results
2.1. Expression and Purification of rCU and U-15N-Labeled rCU
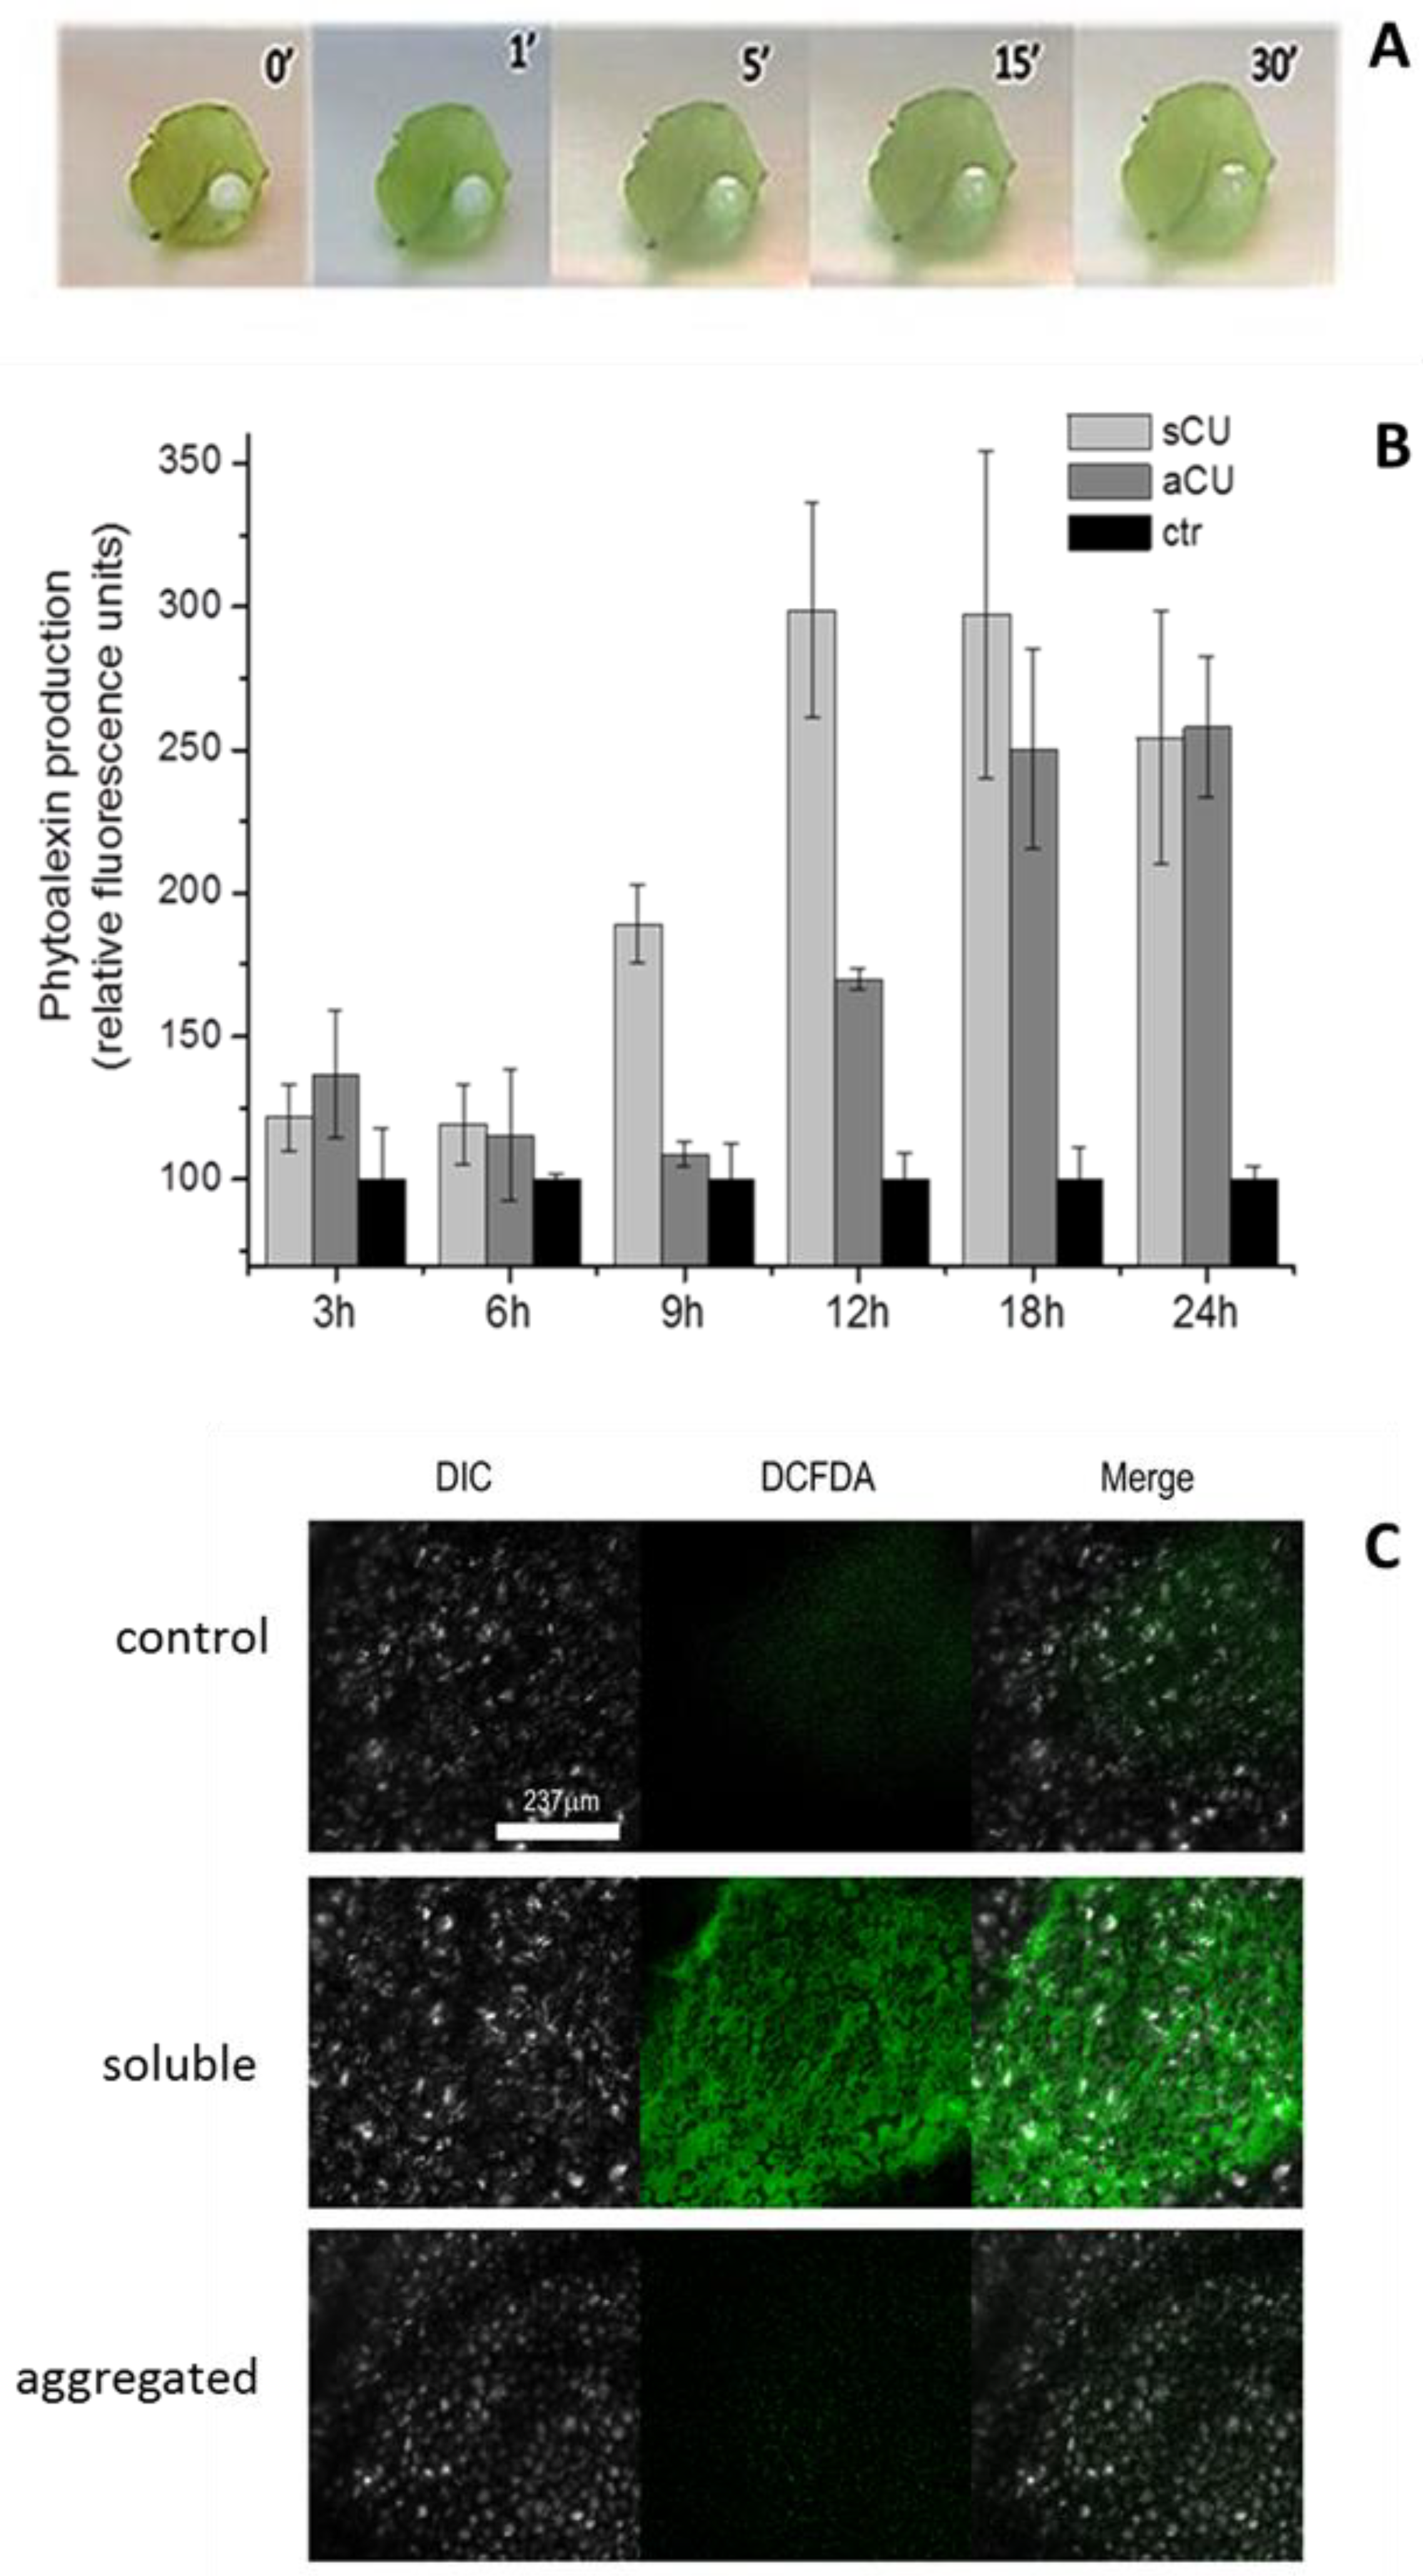
2.2. Biological Activity
2.2.1. Native CU and Recombinant CU have Similar Elicitor Activity
2.2.2. Comparison of the Biological Activity of rCU in Monomeric and Associated Forms
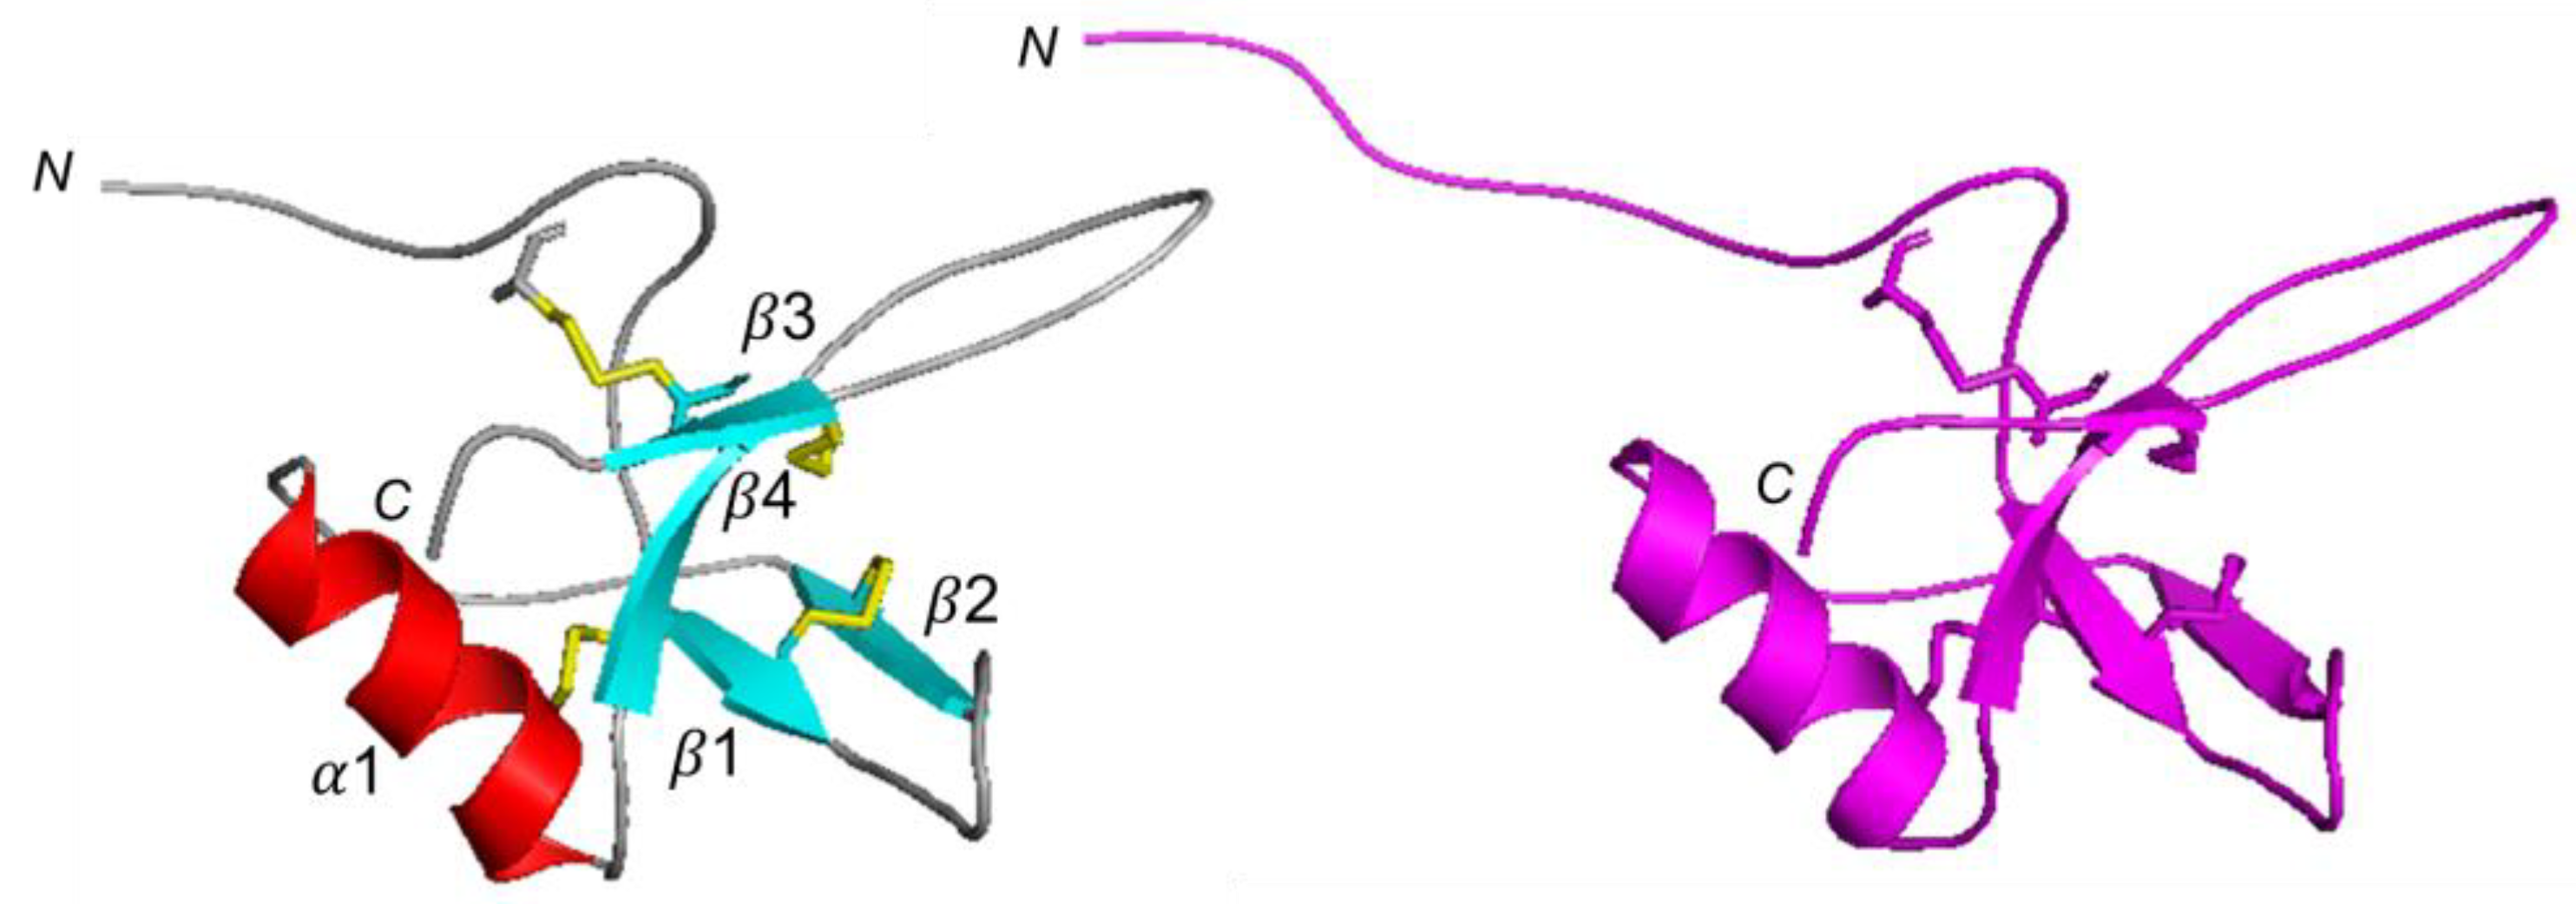
2.3. CU 3D Model
2.4. CU Aggregation/Biofilm Formation
2.5. rCU residues Involved in Slow Conformational Motions
2.6. Identification of Key Residues Involved in Self-Assembly
3. Discussion
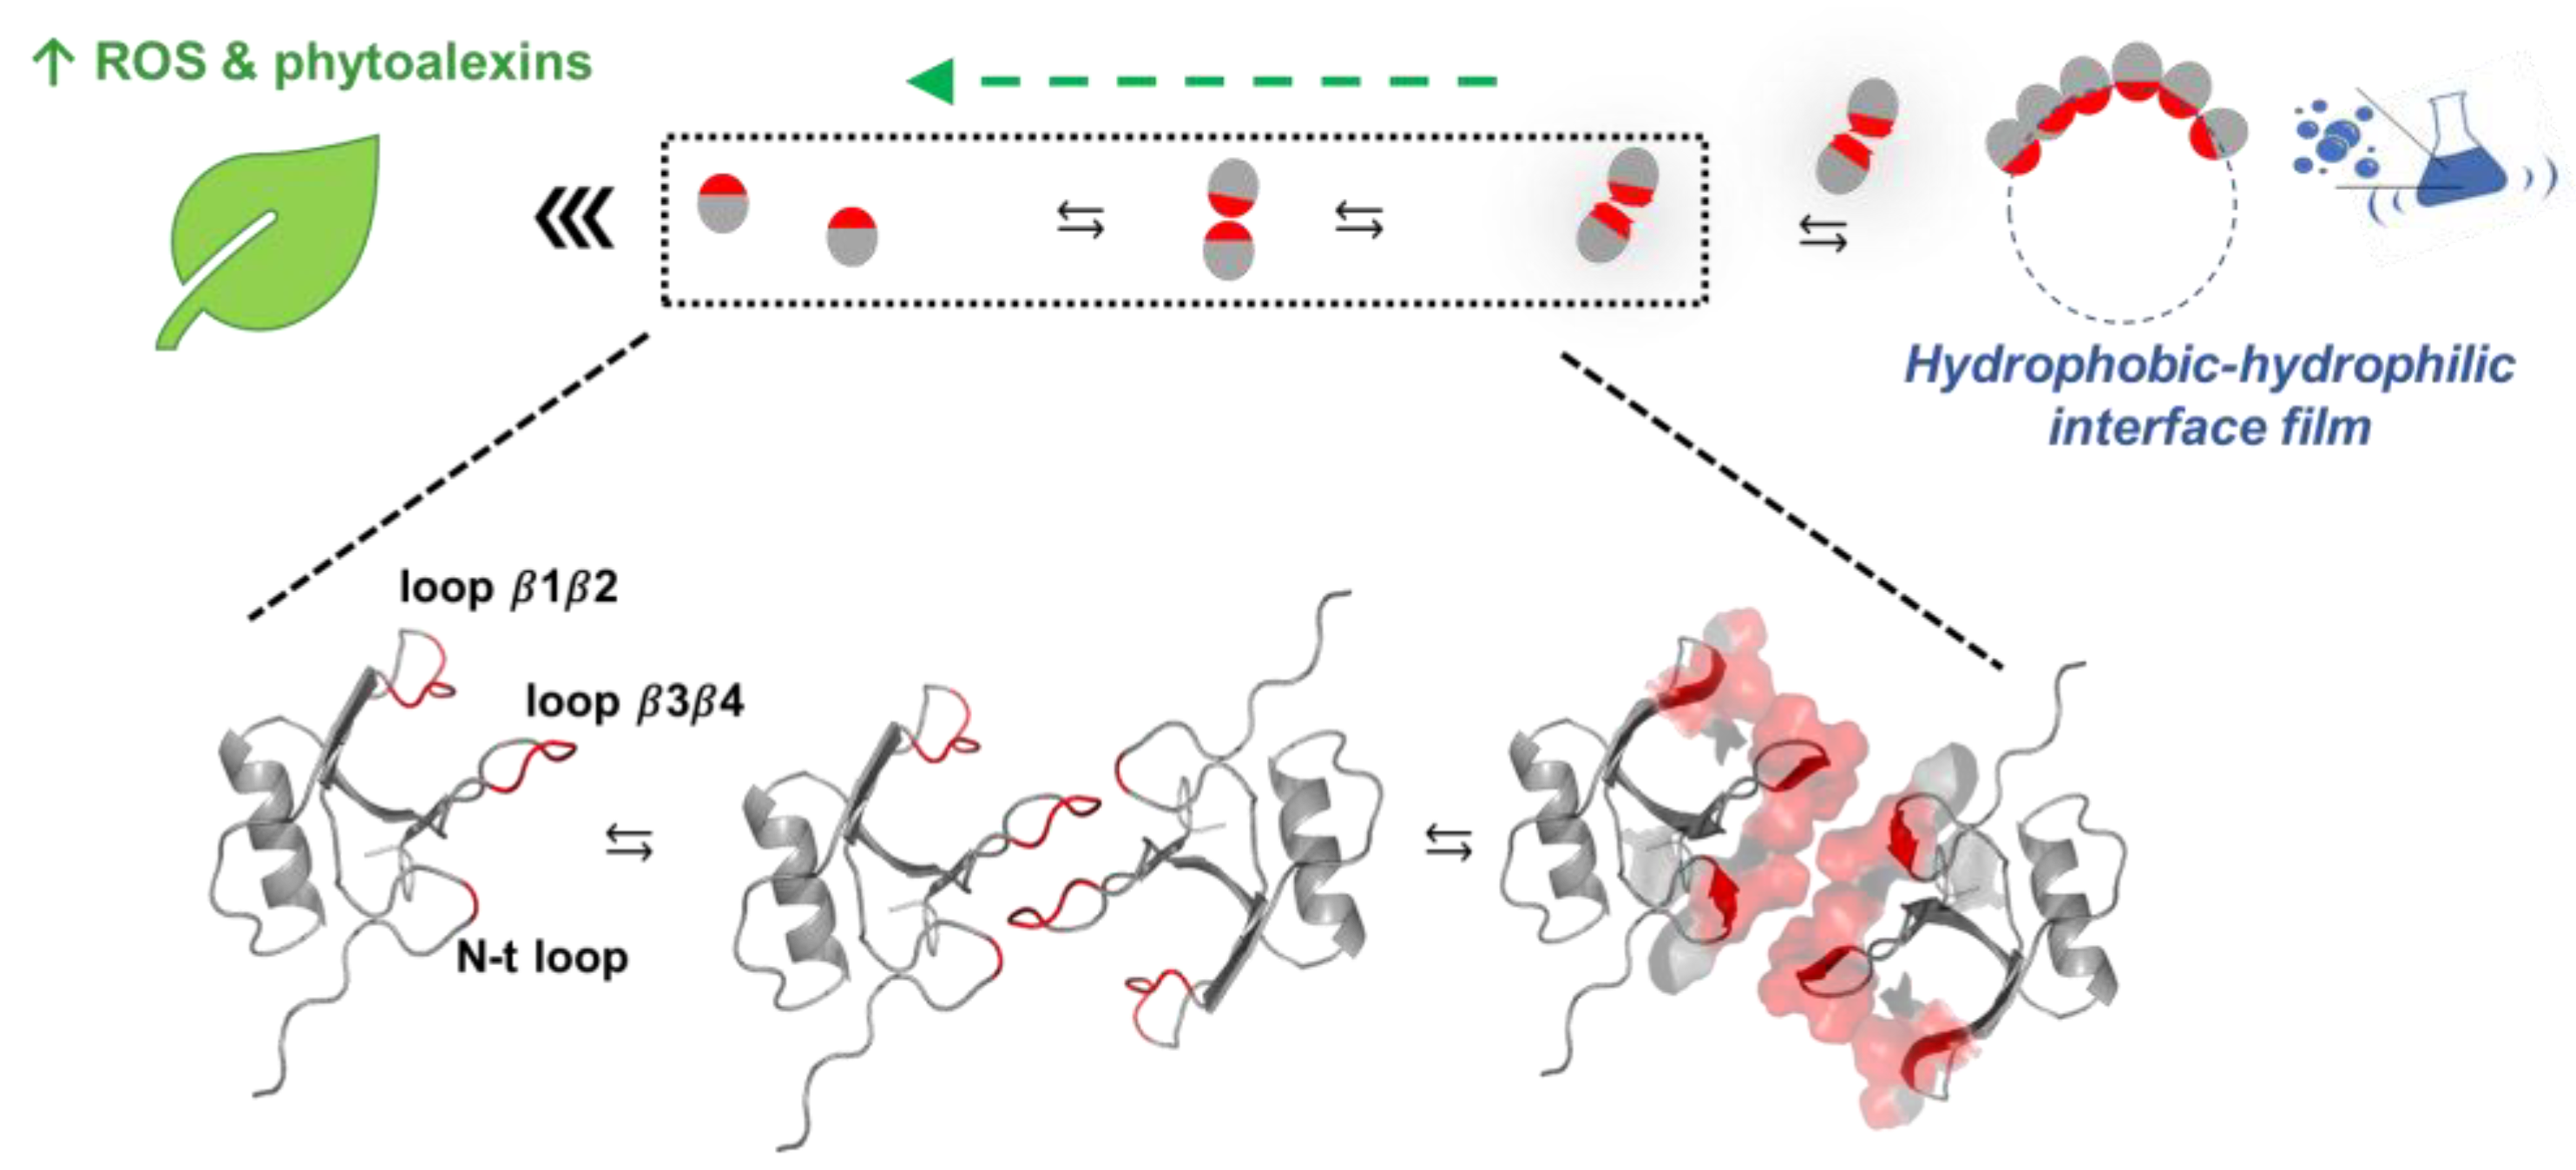
A Molecular Model for CU Biological Activity in Vitro
4. Materials and Methods
4.1. Native Cerato-Ulmin (nCU) and Recombinant Cerato-Ulimin (rCU) Production
4.2. Induction of Aggregation of nCU and rCU
4.3. Evaluation of the Biological/Elicitor Activity
4.4. Nuclear Magnetic Resonance (NMR) Spectroscopy and Modeling
4.4.1. NMR Diffusion Experiments
4.4.2. Chemical Shift Assignment
4.4.3. Model Construction, 1H–15N Residual Dipolar Coupling (DHN) Measurements and Model Validation
4.4.4. H/D Exchange and CLEANEX Measurements
4.4.5. 15N Relaxation Measurements and Backbone Dynamics
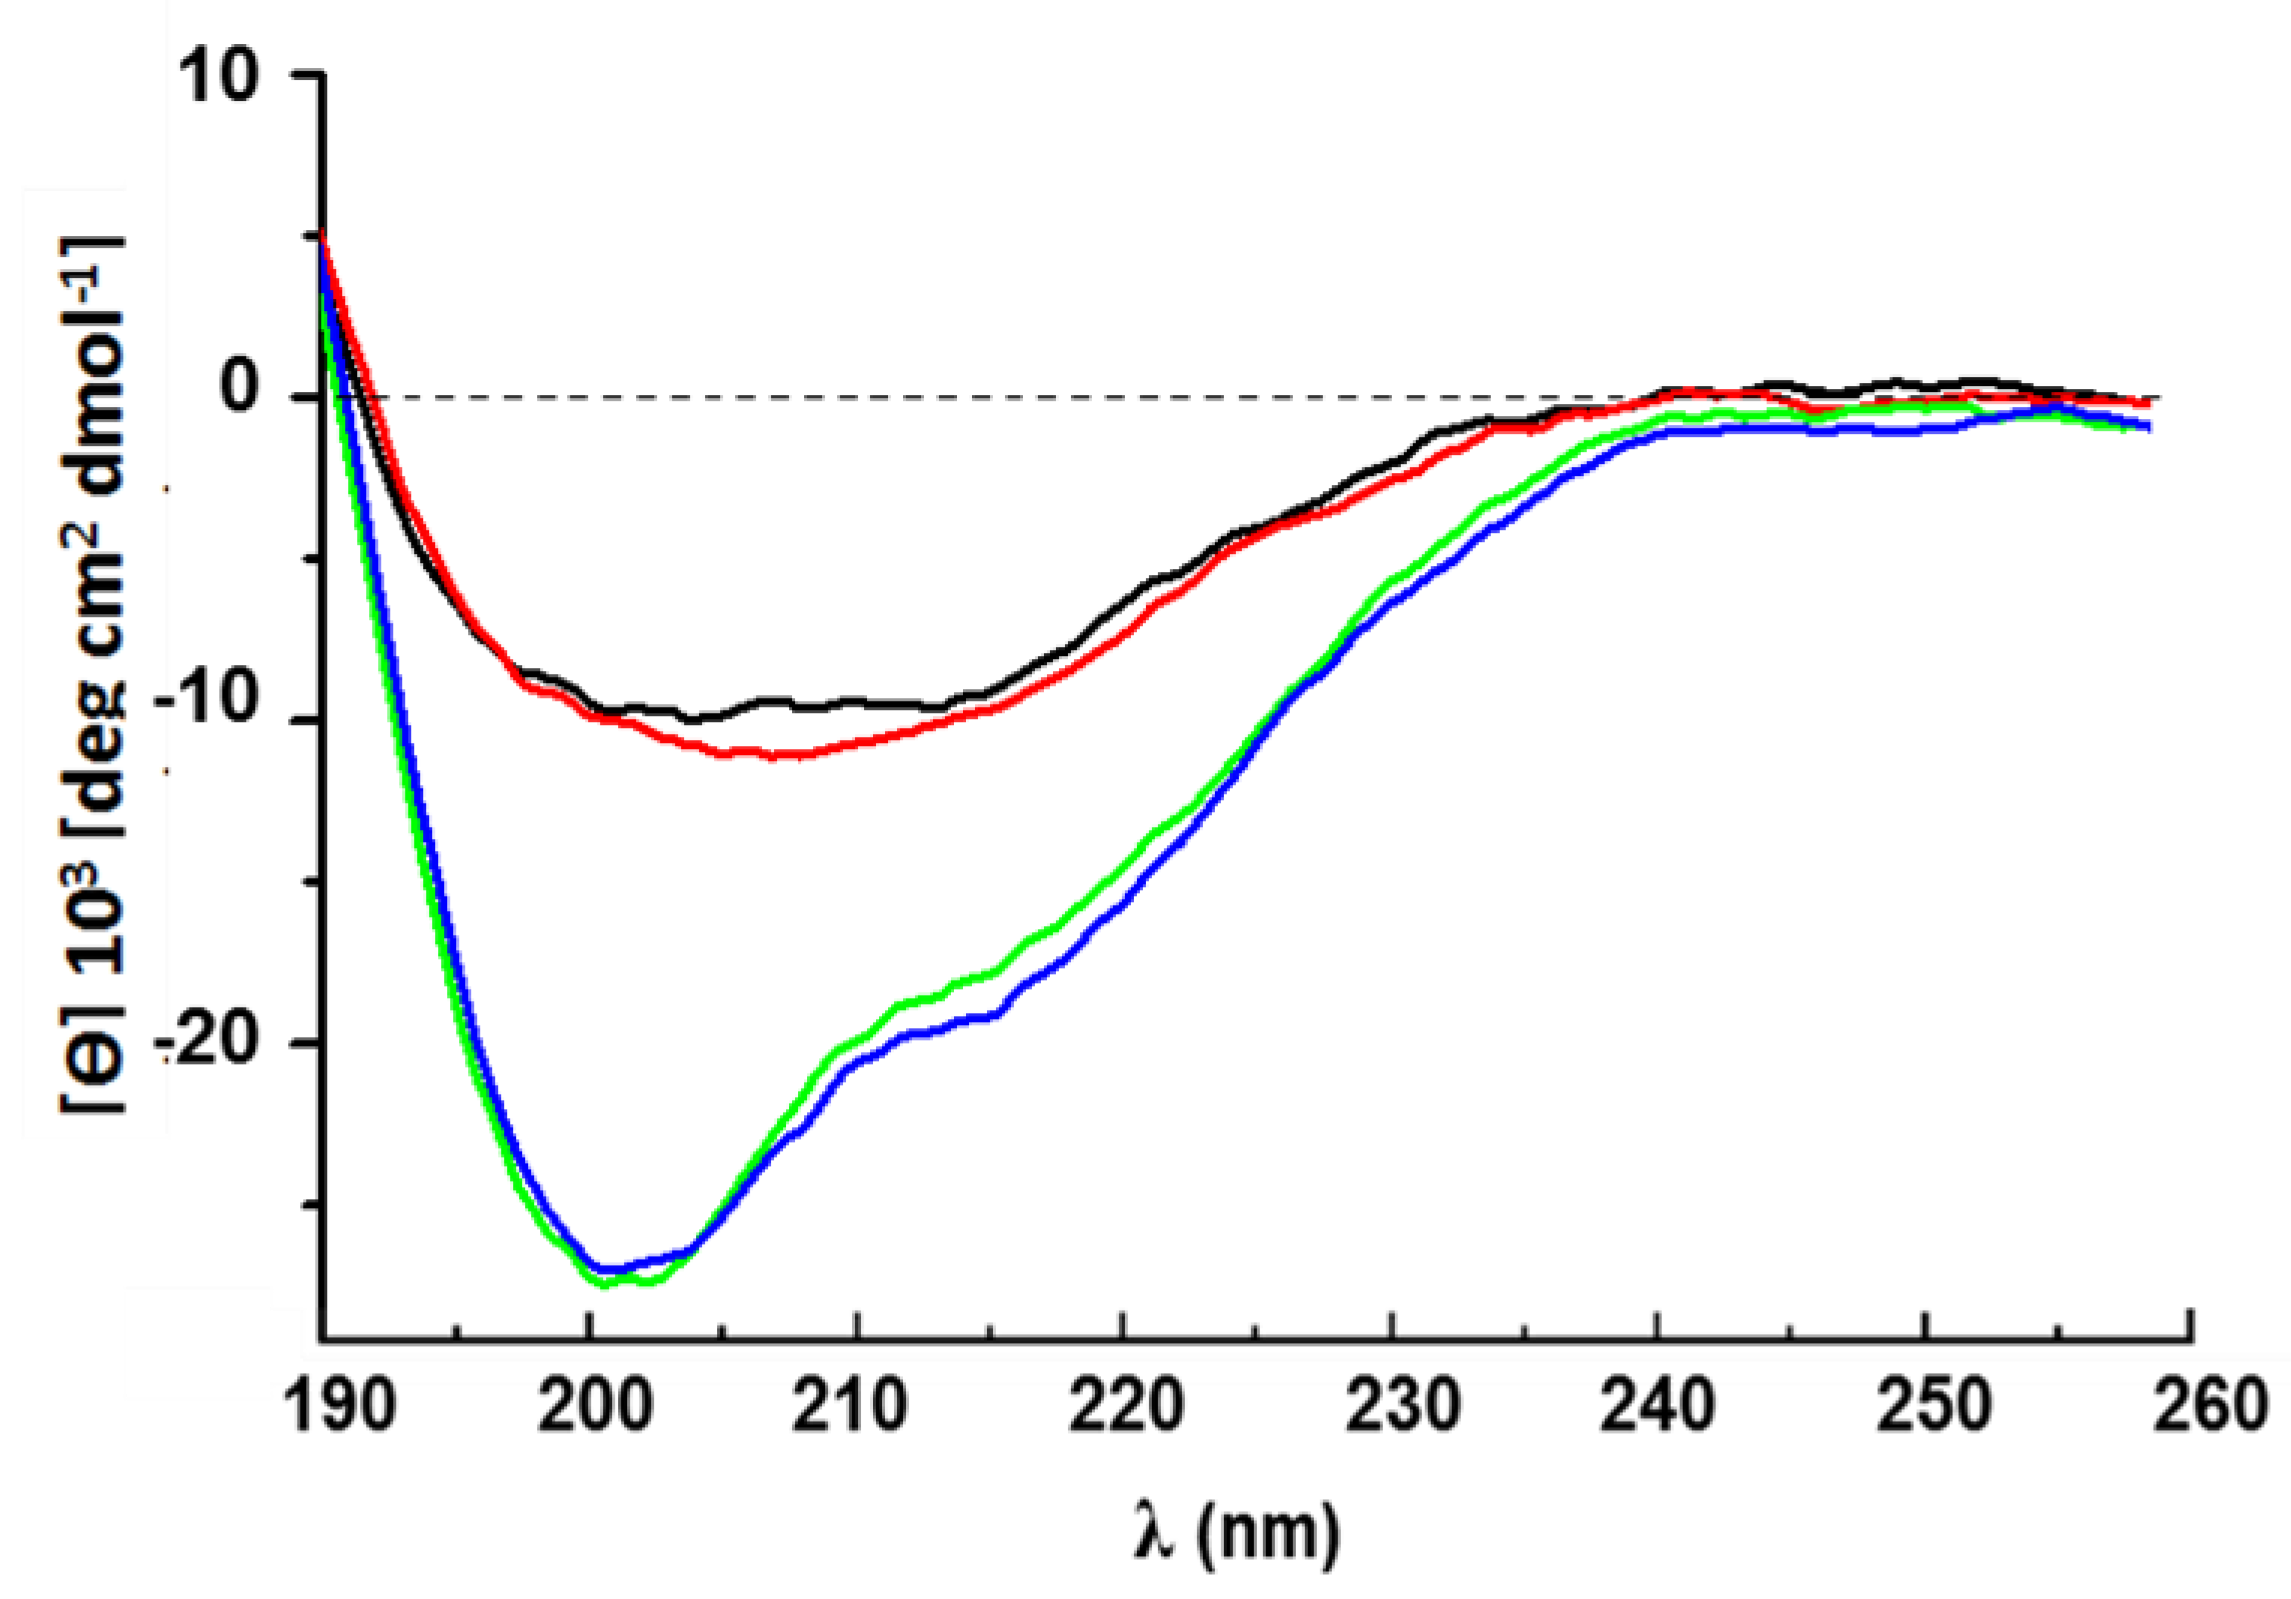
4.4.6. Chemical Shift Perturbation upon Acetonitrile and Phosphate Buffer Titration
4.5. Circular Dichroism Spectroscopy
- →
- 10 µM rCU dissolved in 30% ACN/70% H2O.
- →
- 10 µM rCU dissolved in 30% ACN/70% 50 mM Na-phosphate buffer pH 5.8.
Supplementary Materials
Author Contributions
Funding
Institutional Review Board Statement
Informed Consent Statement
Data Availability Statement
Acknowledgments
Conflicts of Interest
References
- Wösten, H.A.; de Vocht, M.L. Hydrophobins, the fungal coat unravelled. Biochim. Biophys. Acta 2000, 1469, 79–86. [Google Scholar] [CrossRef] [PubMed]
- Linder, M.B.; Szilvay, G.R.; Nakari-Setälä, T.; Penttilä, M.E. Hydrophobins: The protein-amphiphiles of filamentous fungi. FEMS Microbiol. Rev. 2005, 29, 877–896. [Google Scholar] [CrossRef] [PubMed] [Green Version]
- Ball, S.R.; Kwan, A.H.; Sunde, M. Hydrophobin Rodlets on the Fungal Cell Wall. Curr. Top. Microbiol. Immunol. 2020, 425, 29–51. [Google Scholar] [CrossRef]
- Cai, F.; Zhao, Z.; Gao, R.; Chen, P.; Ding, M.; Jiang, S.; Fu, Z.; Xu, P.; Chenthamara, K.; Shen, Q.; et al. The pleiotropic functions of intracellular hydrophobins in aerial hyphae and fungal spores. PLoS Genet. 2021, 17, e1009924. [Google Scholar] [CrossRef] [PubMed]
- Wösten, H.A.B.; Scholtmeijer, K. Applications of hydrophobins: Current state and perspectives. Appl. Microbiol. Biotechnol. 2015, 99, 1587–1597. [Google Scholar] [CrossRef] [PubMed] [Green Version]
- Hakanpää, J.; Paananen, A.; Askolin, S.; Nakari-Setälä, T.; Parkkinen, T.; Penttilä, M.; Linder, M.B.; Rouvinen, J. Atomic resolution structure of the HFBII hydrophobin, a self-assembling amphiphile. J. Biol. Chem. 2004, 279, 534–539. [Google Scholar] [CrossRef] [PubMed] [Green Version]
- Dubey, M.K.; Jensen, D.F.; Karlsson, M. Hydrophobins are required for conidial hydrophobicity and plant root colonization in the fungal biocontrol agent Clonostachys rosea. BMC Microbiol. 2014, 14, 18. [Google Scholar] [CrossRef] [PubMed] [Green Version]
- Guzmán-Guzmán, P.; Alemán-Duarte, M.I.; Delaye, L.; Herrera-Estrella, A.; Olmedo-Monfil, V. Identification of effector-like proteins in Trichoderma spp. and role of a hydrophobin in the plant-fungus interaction and mycoparasitism. BMC Genet. 2017, 18, 16. [Google Scholar] [CrossRef] [Green Version]
- Quarantin, A.; Hadeler, B.; Kröger, C.; Schäfer, W.; Favaron, F.; Sella, L.; Martínez-Rocha, A.L. Different Hydrophobins of Fusarium graminearum Are Involved in Hyphal Growth, Attachment, Water-Air Interface Penetration and Plant Infection. Front. Microbiol. 2019, 10, 751. [Google Scholar] [CrossRef] [Green Version]
- Luti, S.; Bemporad, F.; Vivoli Vega, M.; Leri, M.; Musiani, F.; Baccelli, I.; Pazzagli, L. Partitioning the structural features that underlie expansin-like and elicitor activities of cerato-platanin. Int. J. Biol. Macromol. 2020, 165, 2845–2854. [Google Scholar] [CrossRef]
- Wösten, H.A.B. Hydrophobins: Multipurpose Proteins. Annu. Rev. Microbiol. 2001, 55, 625–646. [Google Scholar] [CrossRef] [PubMed] [Green Version]
- Bowden, C.G.; Hintz, W.E.; Jeng, R.; Hubbes, M.; Horgen, P.A. Isolation and characterization of the cerato-ulmin toxin gene of the Dutch elm disease pathogen, Ophiostoma ulmi. Curr. Genet. 1994, 25, 323–329. [Google Scholar] [CrossRef] [PubMed]
- Scala, A.; Comparini, C.; Tegli, S.; Mittempergher, L.; Scala, F.; del Sorbo, G. Influence of fungal inoculum on cerato-ulmin production. Purification of cerato-ulmin and detection in elm sucker cuttings. Petria 1994, 4, 57–67. [Google Scholar]
- Takai, S. Pathogenicity and cerato-ulmin production in Ceratocystis ulmi. Nature 1974, 252, 124–126. [Google Scholar] [CrossRef]
- Kyte, J.; Doolittle, R.F. A simple method for displaying the hydropathic character of a protein. J. Mol. Biol. 1982, 157, 105–132. [Google Scholar] [CrossRef] [PubMed] [Green Version]
- Sbrana, F.; Fanelli, D.; Vassalli, M.; Carresi, L.; Scala, A.; Pazzagli, L.; Cappugi, G.; Tiribilli, B. Progressive pearl necklace collapse mechanism for cerato-ulmin aggregation film. Eur. Biophys. J. 2010, 39, 971–977. [Google Scholar] [CrossRef] [PubMed]
- Gómez-Pérez, D.; Chaudhry, V.; Kemen, A.; Kemen, E. Amyloid Proteins in Plant-Associated Microbial Communities. Microb. Physiol. 2021, 31, 88–98. [Google Scholar] [CrossRef] [PubMed]
- Askolin, S.; Linder, M.; Scholtmeijer, K.; Tenkanen, M.; Penttilä, M.; de Vocht, M.L.; Wösten, H.A.B. Interaction and comparison of a class I hydrophobin from Schizophyllum commune and class II hydrophobins from Trichoderma Reesei. Biomacromolecules 2021, 7, 1295–1301. [Google Scholar] [CrossRef]
- Scala, F.; Bertelli, E.; Coppola, L.; Del Sorbo, G.; Tegli, S.; Scala, A. Comparative determination of cerato-ulmin on cell surface and in mycelial extracts of pathogenic and non-pathogenic Ophiostoma species. Mycol. Res. 1997, 101, 829–834. [Google Scholar] [CrossRef] [Green Version]
- Sherif, S.; Jones, A.M.P.; Shukla, M.R.; Saxena, P.K. Establishment of invasive and non-invasive reporter systems to investigate American elm–Ophiostoma novo-ulmi interactions. Fungal Genet. Biol. 2014, 71, 32–41. [Google Scholar] [CrossRef]
- Ren, Q.; Kwan, A.H.; Sunde, M. Solution structure and interface-driven self-assembly of NC2, a new member of the Class II hydrophobin proteins. Proteins Struct. Funct. Bioinform. 2014, 82, 990–1003. [Google Scholar] [CrossRef] [PubMed]
- Ahuja, I.; Kissen, R.; Bones, A.M. Phytoalexins in defense against pathogens. Trends Plant Sci. 2012, 17, 73–90. [Google Scholar] [CrossRef] [PubMed]
- Biasini, M.; Bienert, S.; Waterhouse, A.; Arnold, K.; Studer, G.; Schmidt, T.; Kiefer, F.; Cassarino, T.G.; Bertoni, M.; Bordoli, L.; et al. SWISS-MODEL: Modelling protein tertiary and quaternary structure using evolutionary information. Nucleic Acids Res. 2014, 42, W252–W258. [Google Scholar] [CrossRef] [PubMed]
- Laskowski, R.; Rullmann, J.A.; MacArthur, M.; Kaptein, R.; Thornton, J. AQUA and PROCHECK-NMR: Programs for checking the quality of protein structures solved by NMR. J. Biomol. NMR 1996, 8, 477–486. [Google Scholar] [CrossRef] [PubMed]
- Ortega, A.; Amorós, D.; García de la Torre, J. Prediction of Hydrodynamic and Other Solution Properties of Rigid Proteins from Atomic- and Residue-Level Models. Biophys. J. 2011, 101, 892–898. [Google Scholar] [CrossRef] [PubMed] [Green Version]
- Shen, Y.; Delaglio, F.; Cornilescu, G.; Bax, A. TALOS+: A hybrid method for predicting protein backbone torsion angles from NMR chemical shifts. J. Biomol. NMR 2009, 44, 213–223. [Google Scholar] [CrossRef] [PubMed]
- Bax, A. Weak alignment offers new NMR opportunities to study protein structure and dynamics. Protein Sci. 2003, 12, 1–16. [Google Scholar] [CrossRef]
- Niu, M.; Li, Y.; Wang, C.; Han, K. RFAmyloid: A Web Server for Predicting Amyloid Proteins. Int. J. Mol. Sci. 2018, 19, 2071. [Google Scholar] [CrossRef] [Green Version]
- Conchillo-Solé, O.; de Groot, N.S.; Avilés, F.X.; Vendrell, J.; Daura, X.; Ventura, S. AGGRESCAN: A server for the prediction and evaluation of “hot spots” of aggregation in polypeptides. BMC Bioinform. 2007, 8, 65. [Google Scholar] [CrossRef] [Green Version]
- Lipari, G.; Szabo, A. Model-free approach to the interpretation of nuclear magnetic resonance relaxation in macromolecules. 1. Theory and range of validity. J. Am. Chem. Soc. 1982, 104, 4546–4559. [Google Scholar] [CrossRef]
- Fleming, P.J.; Fleming, K.G. HullRad: Fast Calculations of Folded and Disordered Protein and Nucleic Acid Hydrodynamic Properties. Biophys. J. 2018, 114, 856–869. [Google Scholar] [CrossRef] [PubMed]
- Landau, M.; Mayrose, I.; Rosenberg, Y.; Glaser, F.; Martz, E.; Pupko, T.; Ben-Tal, N. ConSurf 2005: The projection of evolutionary conservation scores of residues on protein structures. Nucleic Acids Res. 2005, 33, W299–W302. [Google Scholar] [CrossRef] [PubMed]
- Temple, B.; Horgen, P.A. Biological roles for cerato-ulmin, a hydrophobin secreted by the elm pathogens, Ophiostoma ulmi and O. novo-ulmi. Mycologia 2000, 92, 1–9. [Google Scholar] [CrossRef]
- Dodds, P.N.; Rathjen, J.P. Plant immunity: Towards an integrated view of plant–pathogen interactions. Nat. Rev. Genet. 2010, 11, 539–548. [Google Scholar] [CrossRef] [PubMed]
- Newman, M.-A.; Sundelin, T.; Nielsen, J.T.; Erbs, G. MAMP (microbe-associated molecular pattern) triggered immunity in plants. Front. Plant Sci. 2013, 4, 139. [Google Scholar] [CrossRef] [PubMed] [Green Version]
- Lombardi, L.; Faoro, F.; Luti, S.; Baccelli, I.; Martellini, F.; Bernardi, R.; Picciarelli, P.; Scala, A.; Pazzagli, L. Differential timing of defense-related responses induced by cerato-platanin and cerato-populin, two non-catalytic fungal elicitors. Physiol. Plant. 2013, 149, 408–421. [Google Scholar] [CrossRef] [PubMed]
- Pazzagli, L.; Seidl-Seiboth, V.; Barsottini, M.; Vargas, W.A.; Scala, A.; Mukherjee, P.K. Cerato-platanins: Elicitors and effectors. Plant Science 2014, 228, 79–87. [Google Scholar] [CrossRef] [PubMed]
- Del Sorbo, G.; Scala, A.; Scala, F.; Tegli, S. Cerato-Ulmin, a Toxin Produced by the Pathogens of the Dutch Elm Disease. In Advances in Microbial Toxin Research and Its Biotechnological Exploitation; Springer: Boston, MA, USA, 2002; pp. 93–103. [Google Scholar]
- Ruocco, M.; Lanzuise, S.; Lombardi, N.; Woo, S.L.; Vinale, F.; Marra, R.; Varlese, R.; Manganiello, G.; Pascale, A.; Scala, V.; et al. Multiple Roles and Effects of a Novel Trichoderma Hydrophobin. Mol. Plant-Microbe Interact. 2015, 28, 167–179. [Google Scholar] [CrossRef] [Green Version]
- Fraczkiewicz, R.; Braun, W. Exact and efficient analytical calculation of the accessible surface areas and their gradients for macromolecules. J. Comput. Chem. 1998, 19, 319–333. [Google Scholar] [CrossRef]
- Zhang, X.; Kirby, S.M.; Chen, Y.; Anna, S.L.; Walker, L.M.; Hung, F.R.; Russo, P.S. Formation and elasticity of membranes of the class II hydrophobin Cerato-ulmin at oil-water interfaces. Colloids Surf. B Biointerfaces 2018, 164, 98–106. [Google Scholar] [CrossRef]
- Carresi, L.; Pantera, B.; Zoppi, C.; Cappugi, G.; Oliveira, A.L.; Pertinhez, T.A.; Spisni, A.; Scala, A.; Pazzagli, L. Cerato-platanin, a phytotoxic protein from Ceratocystis fimbriata: Expression in Pichia pastoris, purification and characterization. Protein Expr. Purif. 2006, 49, 159–167. [Google Scholar] [CrossRef] [PubMed]
- Baccelli, I.; Lombardi, L.; Luti, S.; Bernardi, R.; Picciarelli, P.; Scala, A.; Pazzagli, L. Cerato-Platanin Induces Resistance in Arabidopsis Leaves through Stomatal Perception, Overexpression of Salicylic Acid- and Ethylene-Signalling Genes and Camalexin Biosynthesis. PLoS ONE 2014, 9, e100959. [Google Scholar] [CrossRef] [PubMed]
- Delaglio, F.; Grzesiek, S.; Vuister, G.; Zhu, G.; Pfeifer, J.; Bax, A. NMRPipe: A multidimensional spectral processing system based on UNIX pipes. J. Biomol. NMR 1995, 6, 277–293. [Google Scholar] [CrossRef] [PubMed]
- Johnson, B.A. Using NMRView to Visualize and Analyze the NMR Spectra of Macromolecules. Methods Mol. Biol. 2004, 278, 313–352. [Google Scholar] [CrossRef] [PubMed]
- Jones, J.; Wilkins, D.; Smith, L.; Dobson, C. Characterisation of protein unfolding by NMR diffusion measurements. J. Biomol. NMR 1997, 10, 199–203. [Google Scholar] [CrossRef]
- Wilkins, D.K.; Grimshaw, S.B.; Receveur, V.; Dobson, C.M.; Jones, J.A.; Smith, L.J. Hydrodynamic Radii of Native and Denatured Proteins Measured by Pulse Field Gradient NMR Techniques. Biochemistry 1999, 38, 16424–16431. [Google Scholar] [CrossRef] [PubMed]
- Aran, M.; Smal, C.; Pellizza, L.; Gallo, M.; Otero, L.H.; Klinke, S.; Goldbaum, F.A.; Ithurralde, E.R.; Bercovich, A.; Mac Cormack, W.P.; et al. Solution and crystal structure of BA42, a protein from the Antarctic bacterium B izionia argentinensis comprised of a stand-alone TPM domain. Proteins Struct. Funct. Bioinform. 2014, 82, 3062–3078. [Google Scholar] [CrossRef]
- Baroni, F.; Gallo, M.; Pazzagli, L.; Luti, S.; Baccelli, I.; Spisni, A.; Pertinhez, T.A. A mechanistic model may explain the dissimilar biological efficiency of the fungal elicitors cerato-platanin and cerato-populin. Biochim. Biophys. Acta (BBA)-Gen. Subj. 2021, 1865, 129843. [Google Scholar] [CrossRef]
- Ottiger, M.; Delaglio, F.; Bax, A. Measurement ofJand Dipolar Couplings from Simplified Two-Dimensional NMR Spectra. J. Magn. Reson. 1998, 131, 373–378. [Google Scholar] [CrossRef] [Green Version]
- Hansen, M.R.; Mueller, L.; Pardi, A. Tunable alignment of macromolecules by filamentous phage yields dipolar coupling interactions. Nat. Struct. Biol. 1998, 5, 1065–1074. [Google Scholar] [CrossRef]
- Zweckstetter, M.; Bax, A. Prediction of Sterically Induced Alignment in a Dilute Liquid Crystalline Phase: Aid to Protein Structure Determination by NMR. J. Am. Chem. Soc. 2000, 122, 3791–3792. [Google Scholar] [CrossRef]
- Cornilescu, G.; Marquardt, J.L.; Ottiger, M.; Bax, A. Validation of Protein Structure from Anisotropic Carbonyl Chemical Shifts in a Dilute Liquid Crystalline Phase. J. Am. Chem. Soc. 1998, 120, 6836–6837. [Google Scholar] [CrossRef]
- Hwang, T.L.; Van Zjil, P.C.M.; Mori, S. Accurate quantification of water amide proton exchanges rates using the Phase-Modulated CLEAN chemical EXchange (CLEANEX-PM) approach with a Fast-HSQC (FHSQC) detection scheme. J. Biomol. NMR 1998, 11, 221–226. [Google Scholar] [CrossRef] [PubMed]
- Kay, L.E.; Torchia, D.A.; Bax, A. Backbone dynamics of proteins as studied by 15N inverse detected heteronuclear NMR spectroscopy: Application to staphylococcal nuclease. Biochemistry 1989, 28, 8972–8979. [Google Scholar] [CrossRef] [PubMed]
- Noguera, M.E.; Aran, M.; Smal, C.; Vazquez, D.S.; Herrera, M.G.; Roman, E.A.; Alaimo, N.; Gallo, M.; Santos, J. Insights on the conformational dynamics of human frataxin through modifications of loop-1. Arch. Biochem. Biophys. 2017, 636, 123–137. [Google Scholar] [CrossRef]
- Dosset, P.; Hus, J.C.; Blackledge, M.; Marion, D. Efficient analysis of macromolecular rotational diffusion from heteronuclear relaxation data. J. Biomol. NMR 2000, 16, 23–28. [Google Scholar] [CrossRef] [PubMed]
- Lumsdon, S.O.; Green, J.; Stieglitz, B. Adsorption of hydrophobin proteins at hydrophobic and hydrophilic interfaces. Colloids Surf. B Biointerfaces 2005, 44, 172–178. [Google Scholar] [CrossRef]
- de Vocht, M.L.; Scholtmeijer, K.; van der Vegte, E.W.; de Vries, O.M.H.; Sonveaux, N.; Wösten, H.A.B.; Ruysschaert, J.-M.; Hadziioannou, G.; Wessels, J.G.H.; Robillard, G.T. Structural Characterization of the Hydrophobin SC3, as a Monomer and after Self-Assembly at Hydrophobic/Hydrophilic Interfaces. Biophys. J. 1998, 74, 2059–2068. [Google Scholar] [CrossRef]


Disclaimer/Publisher’s Note: The statements, opinions and data contained in all publications are solely those of the individual author(s) and contributor(s) and not of MDPI and/or the editor(s). MDPI and/or the editor(s) disclaim responsibility for any injury to people or property resulting from any ideas, methods, instructions or products referred to in the content. |
© 2023 by the authors. Licensee MDPI, Basel, Switzerland. This article is an open access article distributed under the terms and conditions of the Creative Commons Attribution (CC BY) license (https://creativecommons.org/licenses/by/4.0/).
Share and Cite
Gallo, M.; Luti, S.; Baroni, F.; Baccelli, I.; Cilli, E.M.; Cicchi, C.; Leri, M.; Spisni, A.; Pertinhez, T.A.; Pazzagli, L. Plant Defense Elicitation by the Hydrophobin Cerato-Ulmin and Correlation with Its Structural Features. Int. J. Mol. Sci. 2023, 24, 2251. https://doi.org/10.3390/ijms24032251
Gallo M, Luti S, Baroni F, Baccelli I, Cilli EM, Cicchi C, Leri M, Spisni A, Pertinhez TA, Pazzagli L. Plant Defense Elicitation by the Hydrophobin Cerato-Ulmin and Correlation with Its Structural Features. International Journal of Molecular Sciences. 2023; 24(3):2251. https://doi.org/10.3390/ijms24032251
Chicago/Turabian StyleGallo, Mariana, Simone Luti, Fabio Baroni, Ivan Baccelli, Eduardo Maffud Cilli, Costanza Cicchi, Manuela Leri, Alberto Spisni, Thelma A. Pertinhez, and Luigia Pazzagli. 2023. "Plant Defense Elicitation by the Hydrophobin Cerato-Ulmin and Correlation with Its Structural Features" International Journal of Molecular Sciences 24, no. 3: 2251. https://doi.org/10.3390/ijms24032251